
Originally reported November 15, 2026, at 01:49 (+08:00). This is a historical snapshot, not a current reading.
A spot Bitcoin ETF flow chart measures money entering and leaving the funds, not Bitcoin’s price. In The Block’s analysis of SoSoValue data, U.S. spot Bitcoin ETFs recorded $1.07 billion in net outflows across all five trading days of the reported week. It was their second consecutive week with more than $1 billion in outflows; the two-week total reached $2.35 billion.
Friday marked the funds’ seventh straight trading day of net outflows. That run, which began November 5, totaled $1.91 billion—the longest such streak since a 10-session run from June 17 to July 1. Of Friday’s $185.5 million outflow, BlackRock’s IBIT accounted for $143.5 million and Fidelity’s FBTC for $41.9 million, according to SoSoValue.
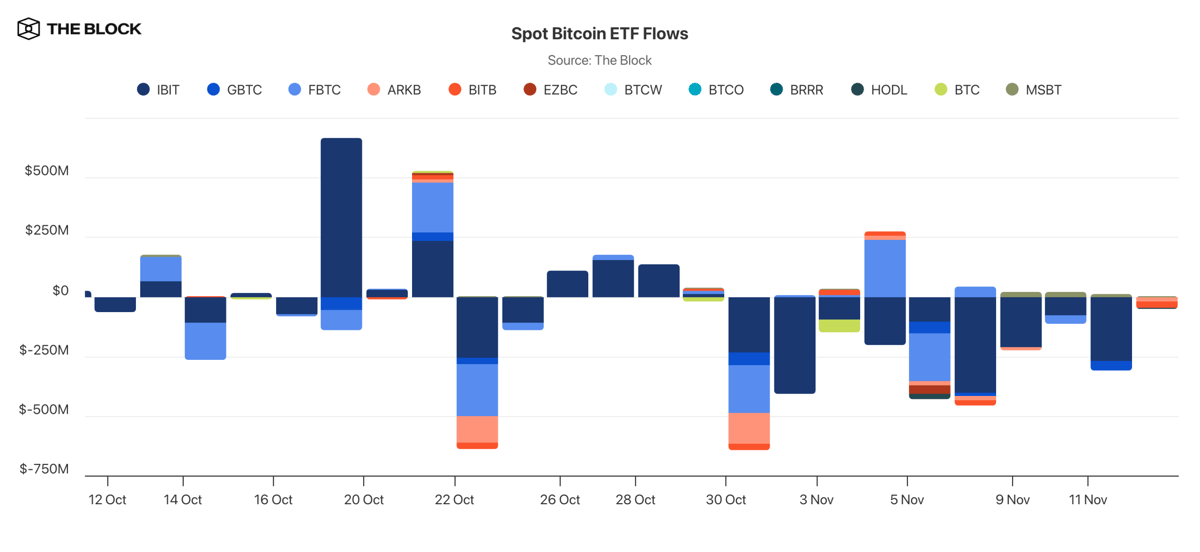
The weakness extended beyond Bitcoin funds. U.S. spot crypto ETFs had approximately $1.55 billion in combined net outflows for the week. Of the 15 categories SoSoValue tracks, Avalanche funds were the only one with a weekly inflow, at $227,000. Spot ether ETFs lost $398.9 million.
The Block reported that Bitcoin fell below $69,000 early Friday and was trading around $65,650 on Saturday morning. ETF flows describe fund activity; this sequence alone does not establish what caused the price move or predict where Bitcoin goes next.
Source: theblock.co (originally published 2026-11-15 01:49 UTC+8)