
Bitcoin fell to around $62,100 on Sunday, November 15, 2026, its lowest level since July 14, after six consecutive weeks of losses. It recovered to around $64,300 early Monday. As reported on November 17, the question was whether that bounce could hold—not whether an indicator had identified a bottom.
Liquidations and ETF flows measure different pressures
Roughly $2 billion in crypto derivatives positions were forcibly closed during the weekend slide, mostly bets on rising prices. CoinGlass figures for one 24-hour period on Saturday showed $1.9 billion in liquidations across cryptocurrencies, including about $1.8 billion in bullish positions. Those figures are not Bitcoin-only liquidations. A liquidation occurs when an exchange closes a leveraged position after the funds supporting it can no longer cover its losses.
U.S. spot Bitcoin ETFs had recorded seven consecutive trading sessions of net outflows. Decrypt’s ETF tracker showed $185.4 million leaving the funds on Friday, bringing net withdrawals since November 5 to approximately $1.91 billion. BlackRock’s IBIT accounted for $143.5 million of Friday’s outflows and Fidelity’s FBTC for $41.9 million. These flow figures track fund creations and redemptions, not every trade between investors. Because U.S. ETFs do not trade over the weekend, Friday’s data showed weaker demand before Sunday’s drop—not redemptions during it.
What the chart levels could—and could not—say
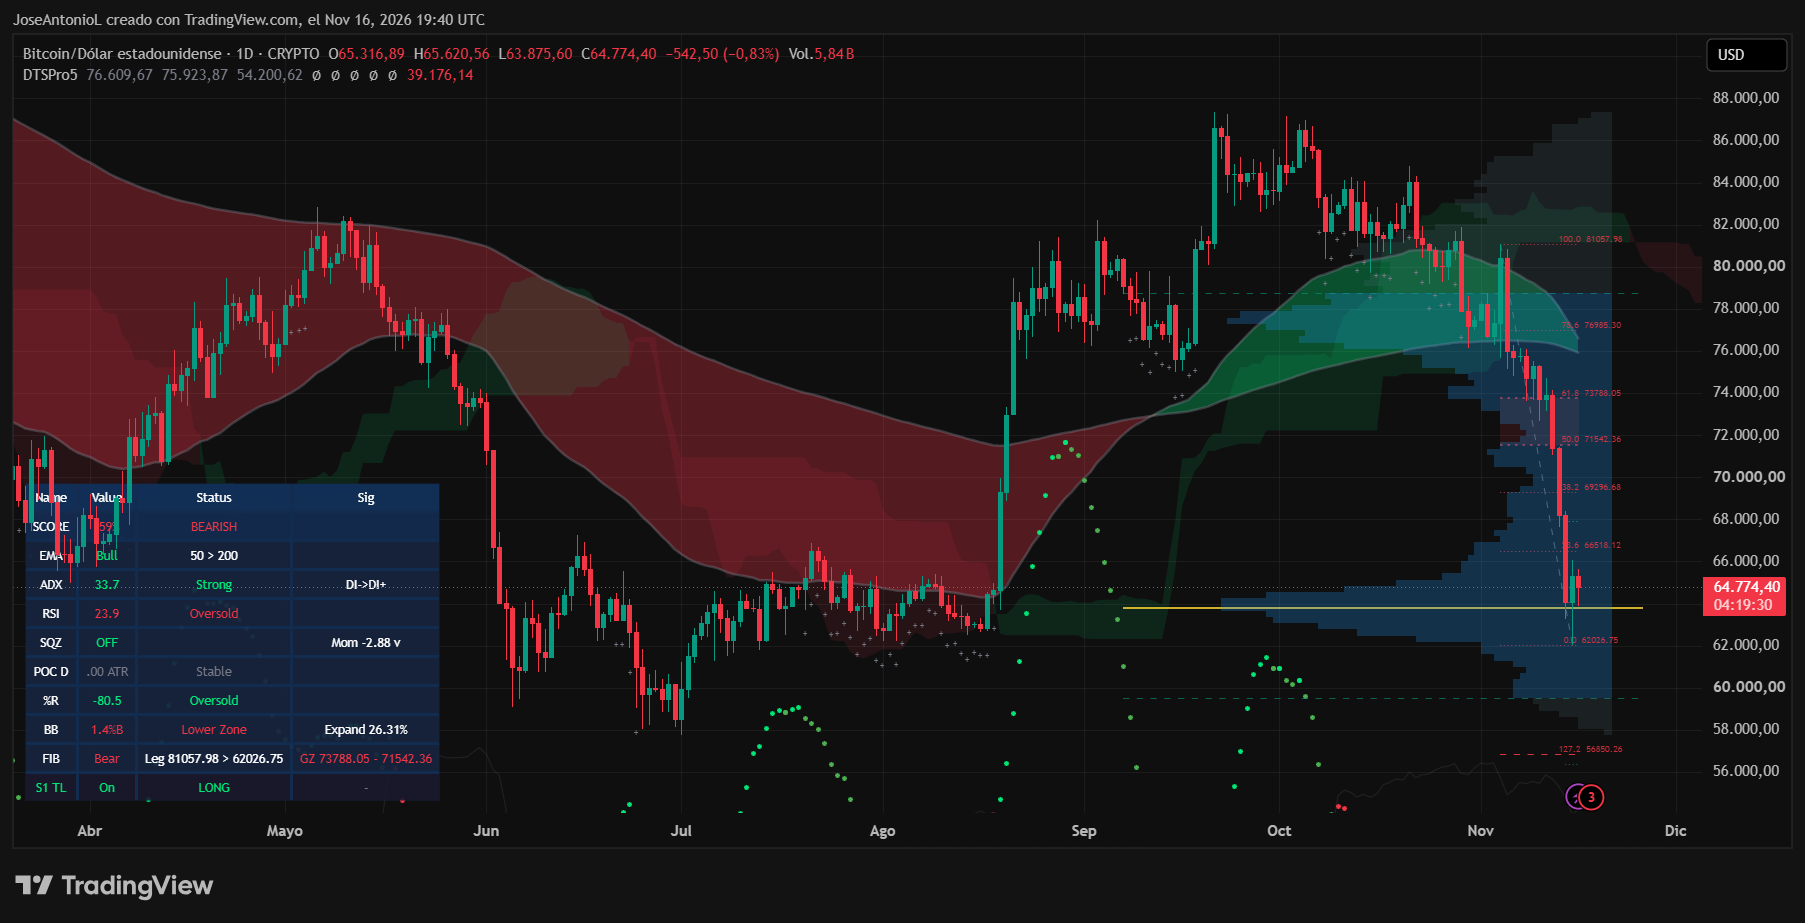
The daily Relative Strength Index (RSI) was near 24, in oversold territory, while the weekly RSI was near 38: weak, but not oversold. The Average Directional Index (ADX) was above 33, indicating a strong prevailing trend, with bearish directional pressure dominating. An oversold reading describes recent momentum; it does not establish when selling will end.
Bitcoin bounced after approaching support around $62,000. The chart identified potential resistance at $66,500–$67,200 and then around $69,300 using Fibonacci levels. A decisive move below $62,000 would bring the psychologically important $60,000 level back into focus. These are reference levels drawn from the chart, not forecasts that price must follow.
The next evidence to watch in the November 17 report was Monday’s U.S. ETF-flow data and demand for downside protection in options. The November 27 options expiration was still ahead, with $50,000 puts among the contracts seeing the most recent trading activity.