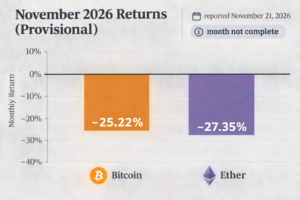
The GMCI Index tracks the performance of the 30 largest cryptocurrencies by market capitalization. It is a broad-market measure, not a Bitcoin valuation model. In reporting published on November 17, 2026, The Block said the index had fallen 13.8% over seven days. Its price data showed Bitcoin down about 13% over the same period and 20.8% over 30 days, with its price reaching $64,000.
Grayscale Head of Research Zach Pandl called the lower prices “compelling entry points” for medium- and longer-term investors. That is his assessment, not a conclusion established by the price declines. He argued that demand for digital assets remained strong, citing institutional adoption of stablecoins and tokenized assets, as well as deficit spending that he said supports demand for alternative stores of value.
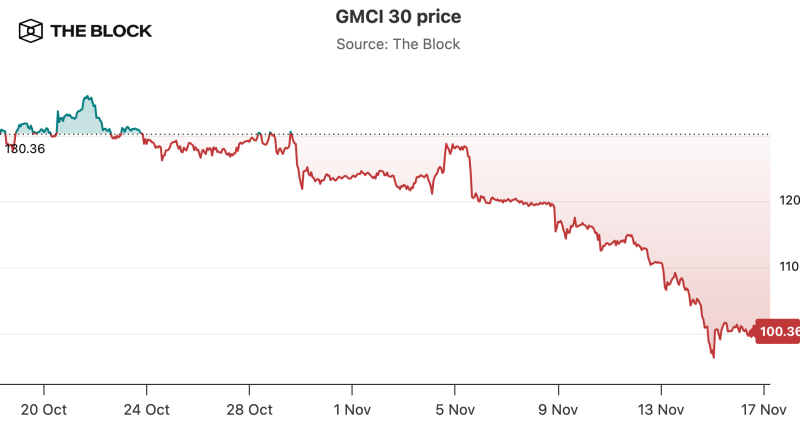
Pandl attributed the sell-off partly to stablecoin outflows into fiat currencies that he said accelerated after a security incident at Binance in late October. He also pointed to weakness spilling over from AI-related equities as portfolios holding both technology stocks and crypto reduced risk. In his view, technical factors amplified the move: Bitcoin fell below its 200-day moving average on November 12, a level used as a sell signal by trend-following funds, while falling prices triggered liquidations of leveraged perpetual-futures positions.
A moving-average breach describes a change in price trend; it does not establish where Bitcoin will trade next. Pandl also said the macroeconomic backdrop remained challenging. Grayscale’s note said exchange-traded product outflows did not appear extreme and that the pullback did not appear closely tied to a planned Anthropic IPO or pressure on Strategy.