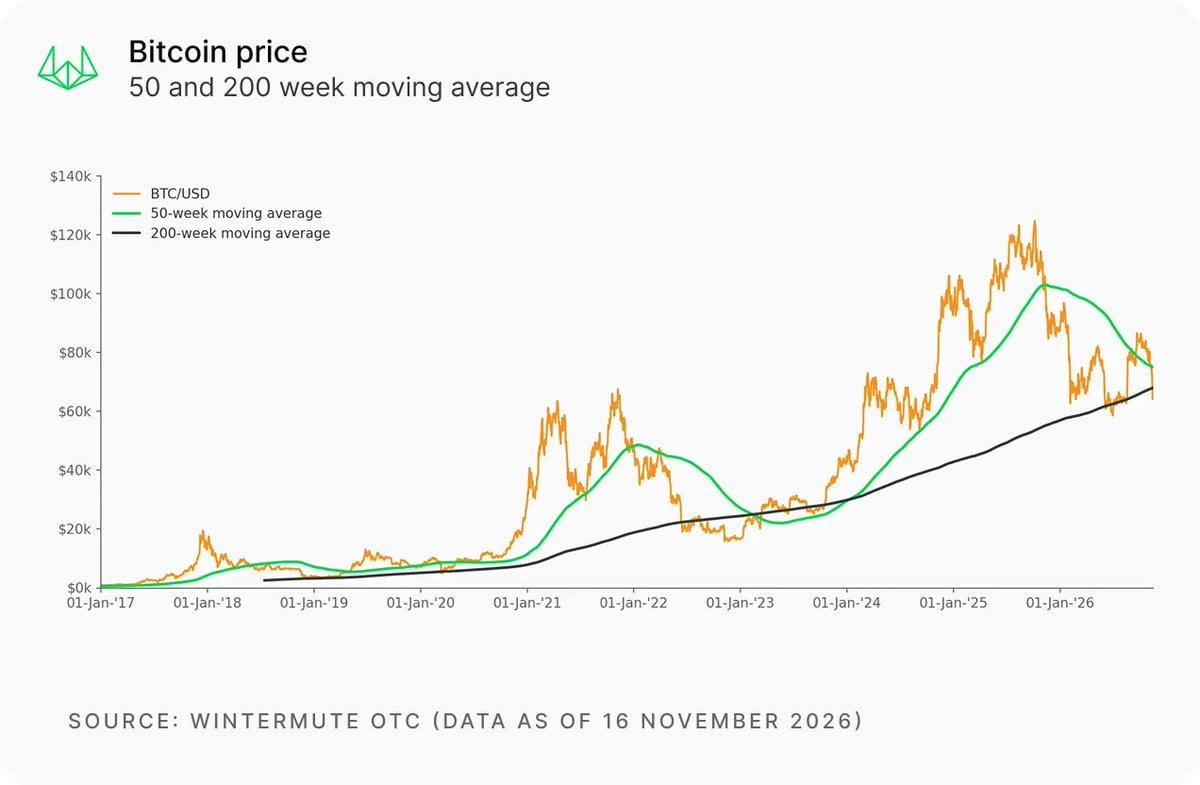
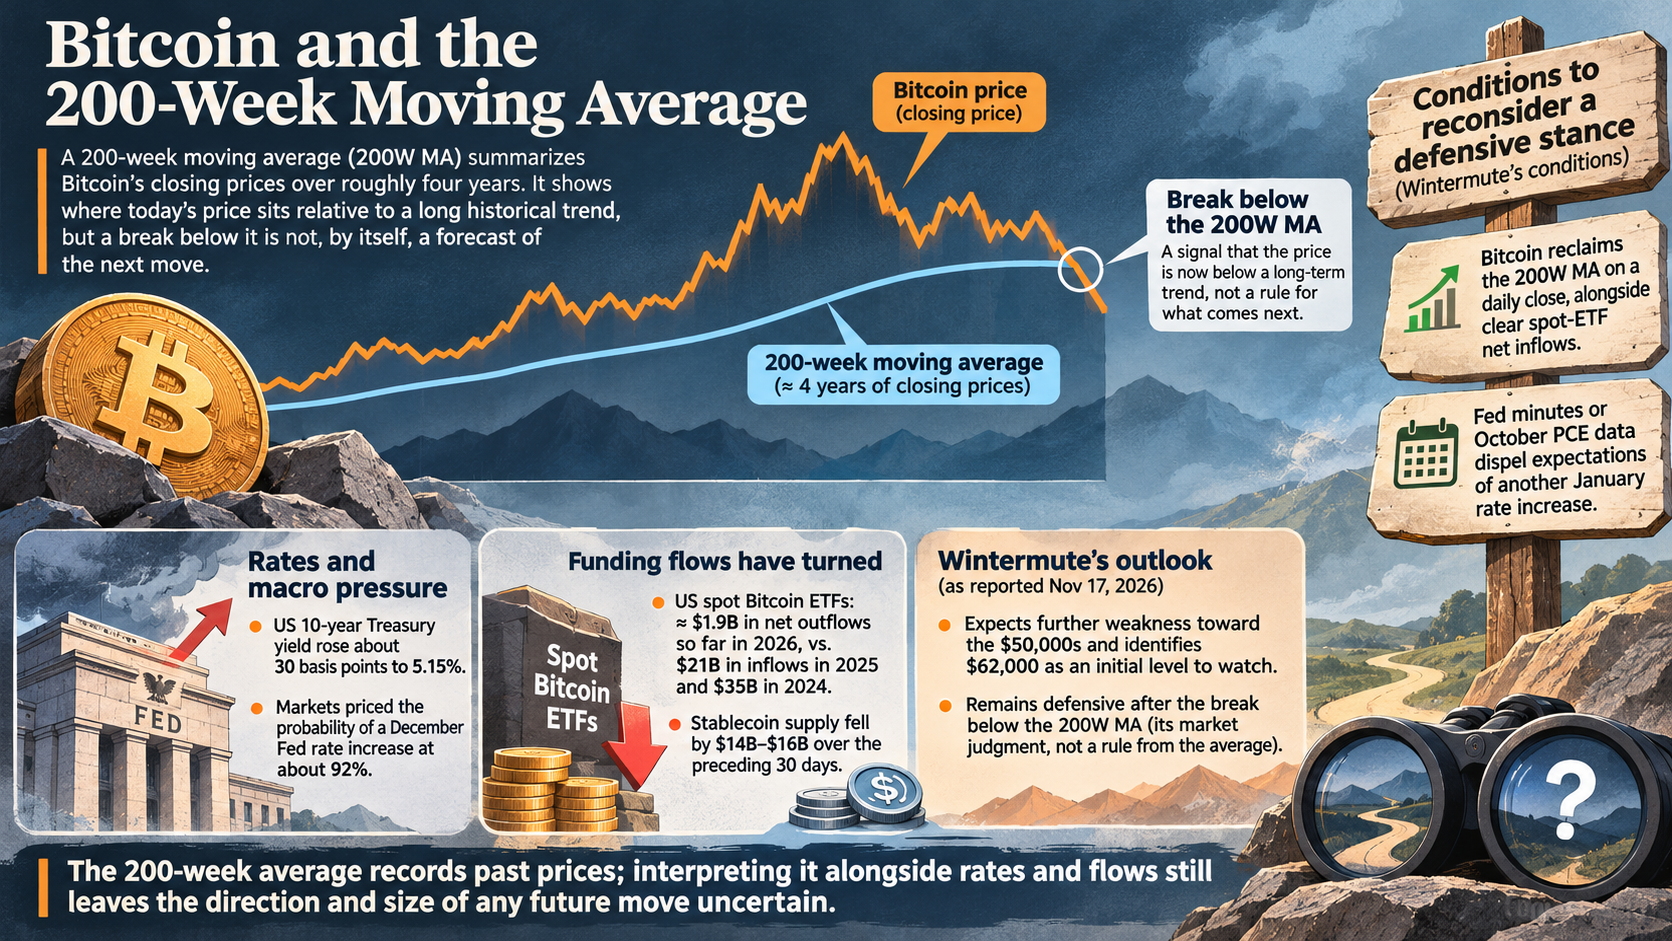
A 200-week moving average summarizes Bitcoin’s closing prices over roughly four years. It can show where the current price sits relative to a long historical trend, but a break below it is not, by itself, a forecast of the next move.
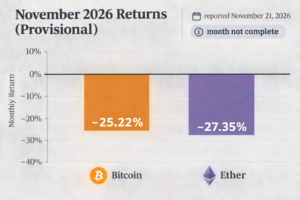
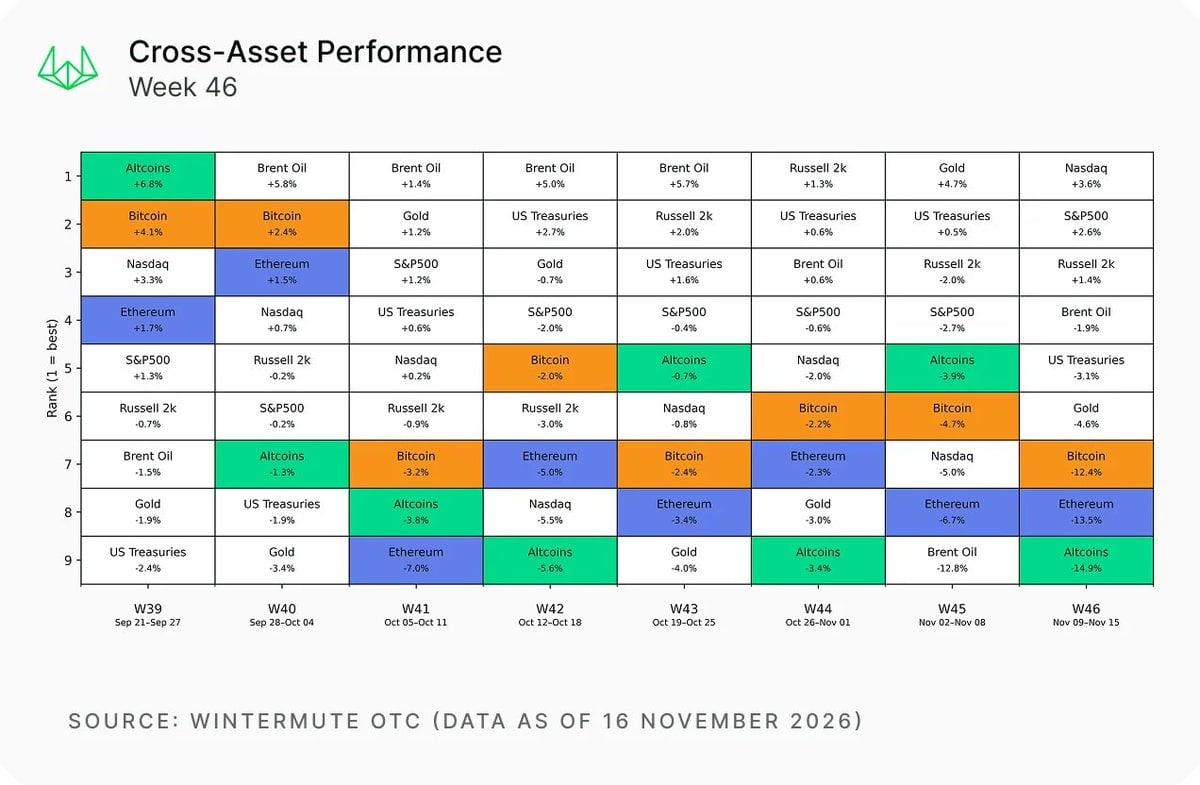
In a report published on November 17, 2026, Wintermute said Bitcoin had fallen 12.7% over the week to $65,400, closing below a 200-week average near $68,000. It also reported a Saturday low of $62,000. Wintermute interpreted the break as a reason to remain defensive; that is its market judgment, not a rule established by the moving average.
Rates and funding flows
Wintermute linked the sell-off to a repricing of interest-rate expectations. It reported that the US 10-year Treasury yield rose about 30 basis points over the week to 5.15%, while markets priced the probability of a December Federal Reserve rate increase at about 92%. In its account, higher yields put pressure on assets that do not pay income, including Bitcoin.
The report also cited approximately $1.9 billion in net outflows from US spot Bitcoin ETFs so far in 2026, compared with net inflows of $21 billion in 2025 and $35 billion in 2024. Wintermute estimated that stablecoin supply had fallen by $14 billion–$16 billion over the preceding 30 days. Those measures describe different funding channels; neither establishes that the moving-average break caused the outflows.
A conditional outlook, not a price target from a chart
Wintermute expected further weakness toward the $50,000s and identified $62,000 as an initial level to watch. It said it would reconsider its short-term defensive stance if Bitcoin reclaimed the 200-week average on a daily close alongside clear spot-ETF net inflows, or if forthcoming Fed minutes or October PCE data dispelled expectations of another January rate increase.
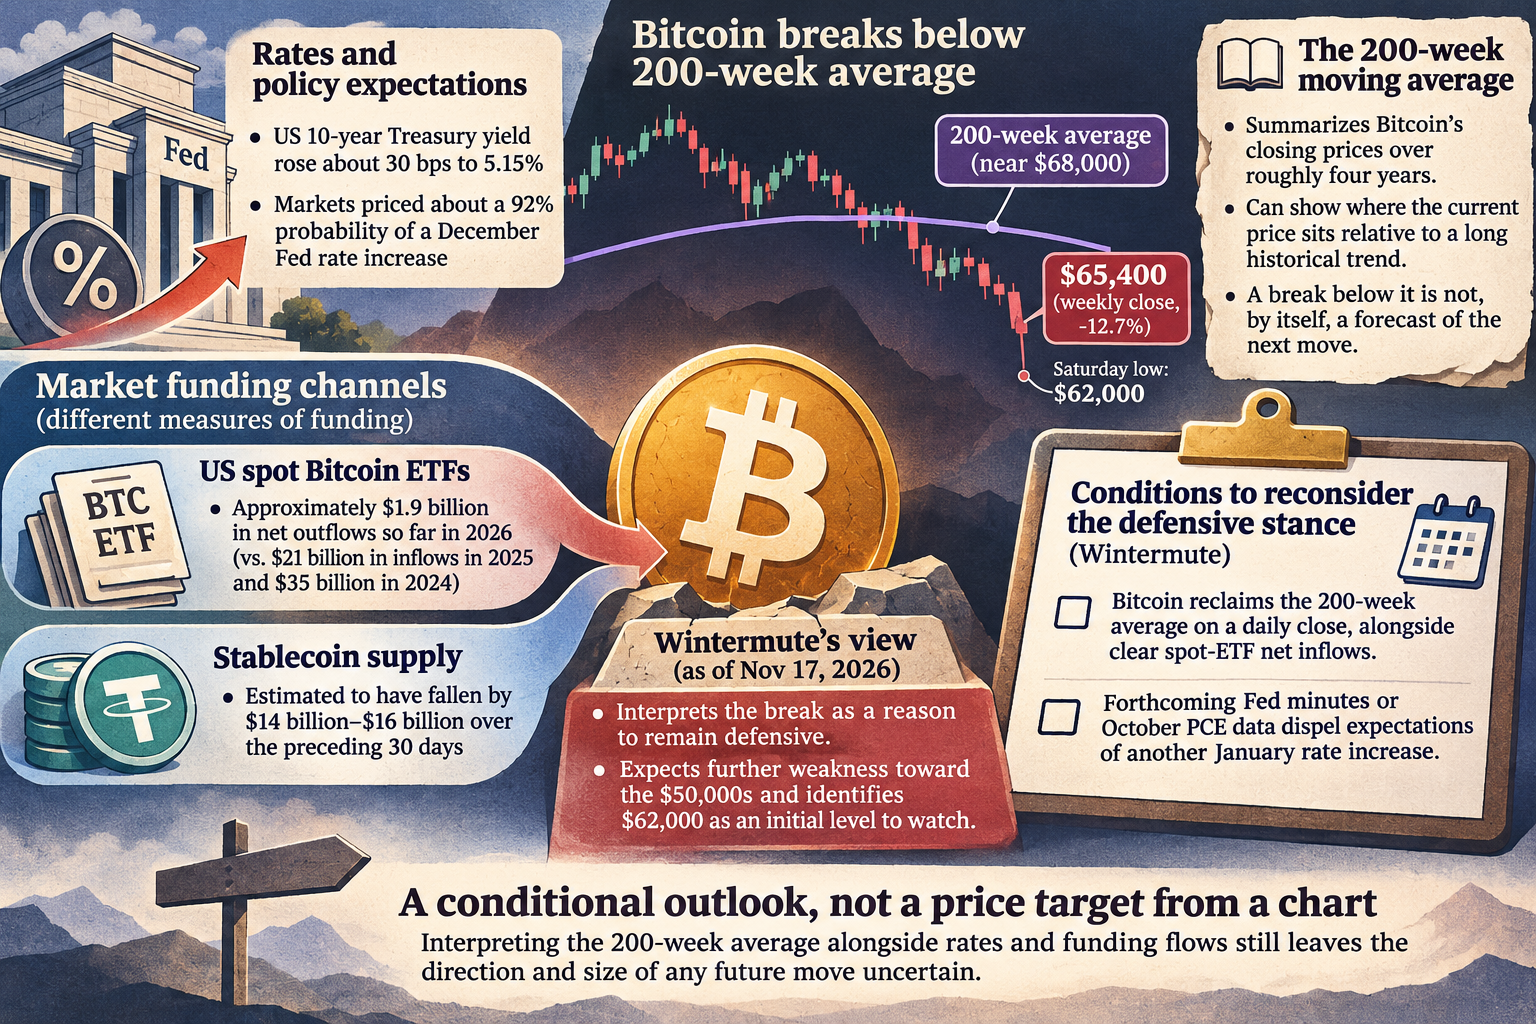
Those are Wintermute’s conditions and forecast as reported on November 17, 2026. The 200-week average records past prices; interpreting it alongside rates and flows still leaves the direction and size of any future move uncertain.