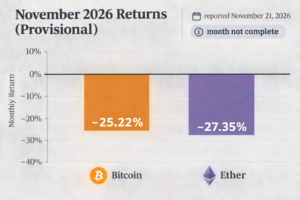
Reported November 21, 2026 (UTC+8), covering Friday’s market moves.
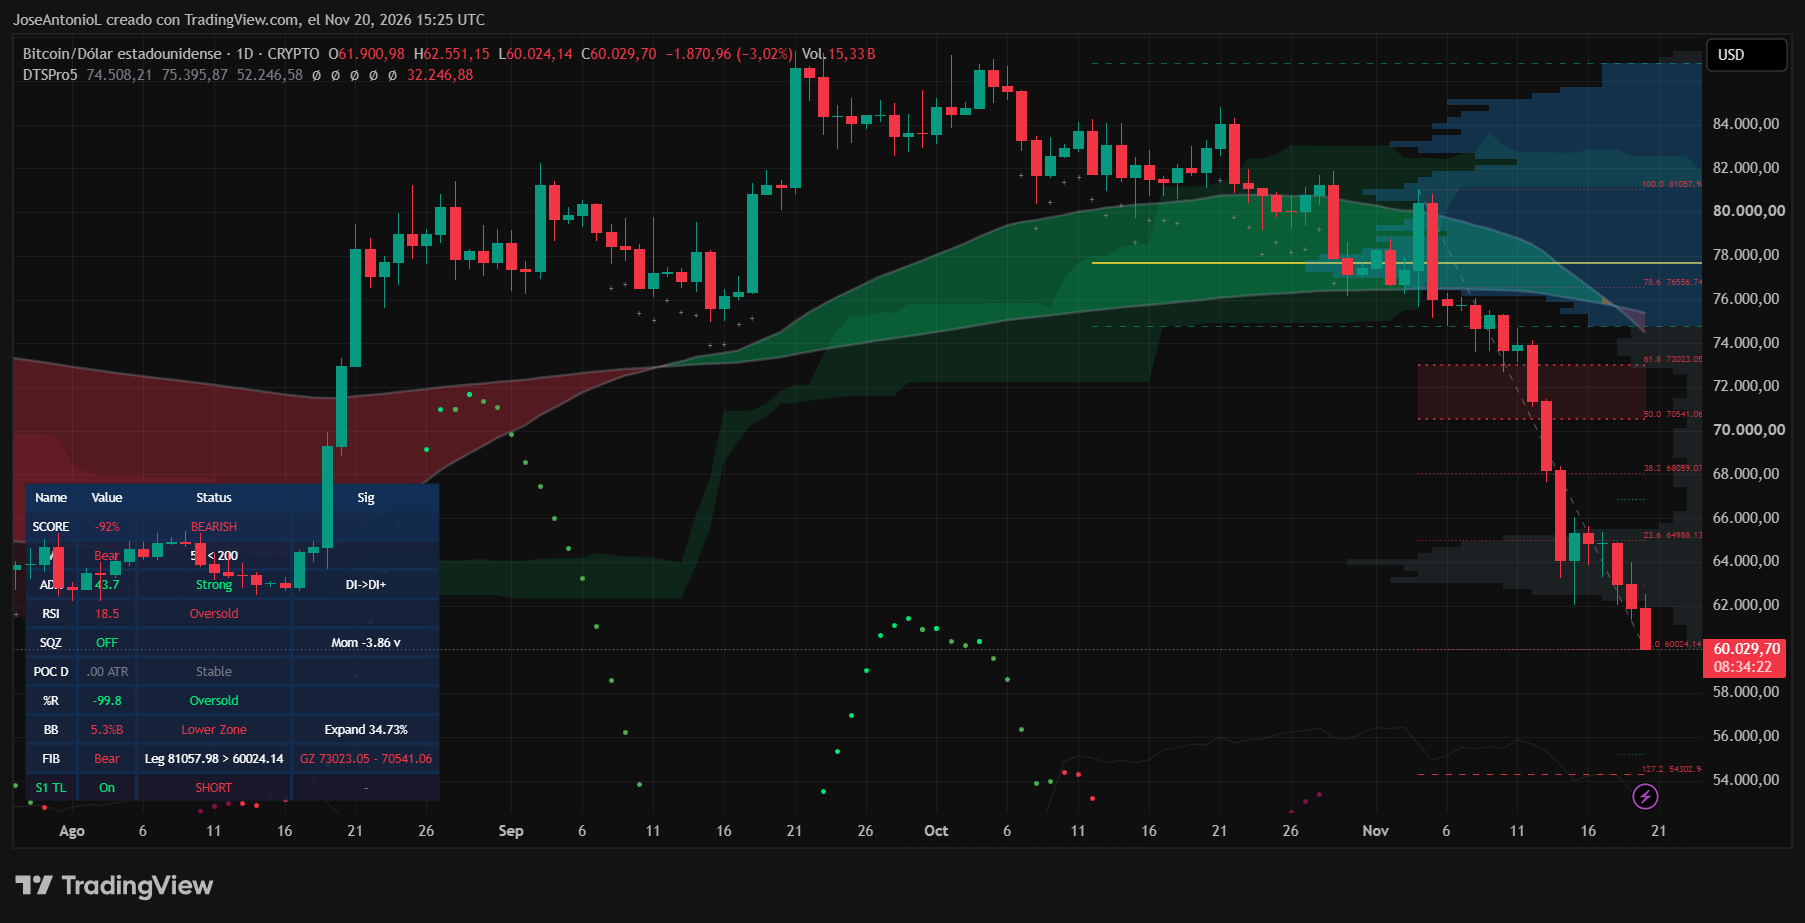
Bitcoin fell below $60,000 on Friday, November 20. The reported daily chart showed BTC at $59,703.72, down 3.55% for the session after touching $59,300. The break matters as a move through both a round-number threshold and a price area Bitcoin had revisited in 2024 and during a mid-2026 retreat. It does not, on its own, establish where the price will go next.
What the sentiment and flow figures show
The Crypto Fear and Greed Index fell to 9, a reading classified as “extreme fear” and its lowest since February. It had stood at 18 a week earlier and 51 a month earlier. The index runs from zero, indicating maximum fear, to 100, indicating extreme greed, and uses market data rather than individual investor surveys. Its 2026 low was 5 on February 5; its high was 82 on August 26. It describes market sentiment, not a reliable turning-point signal.
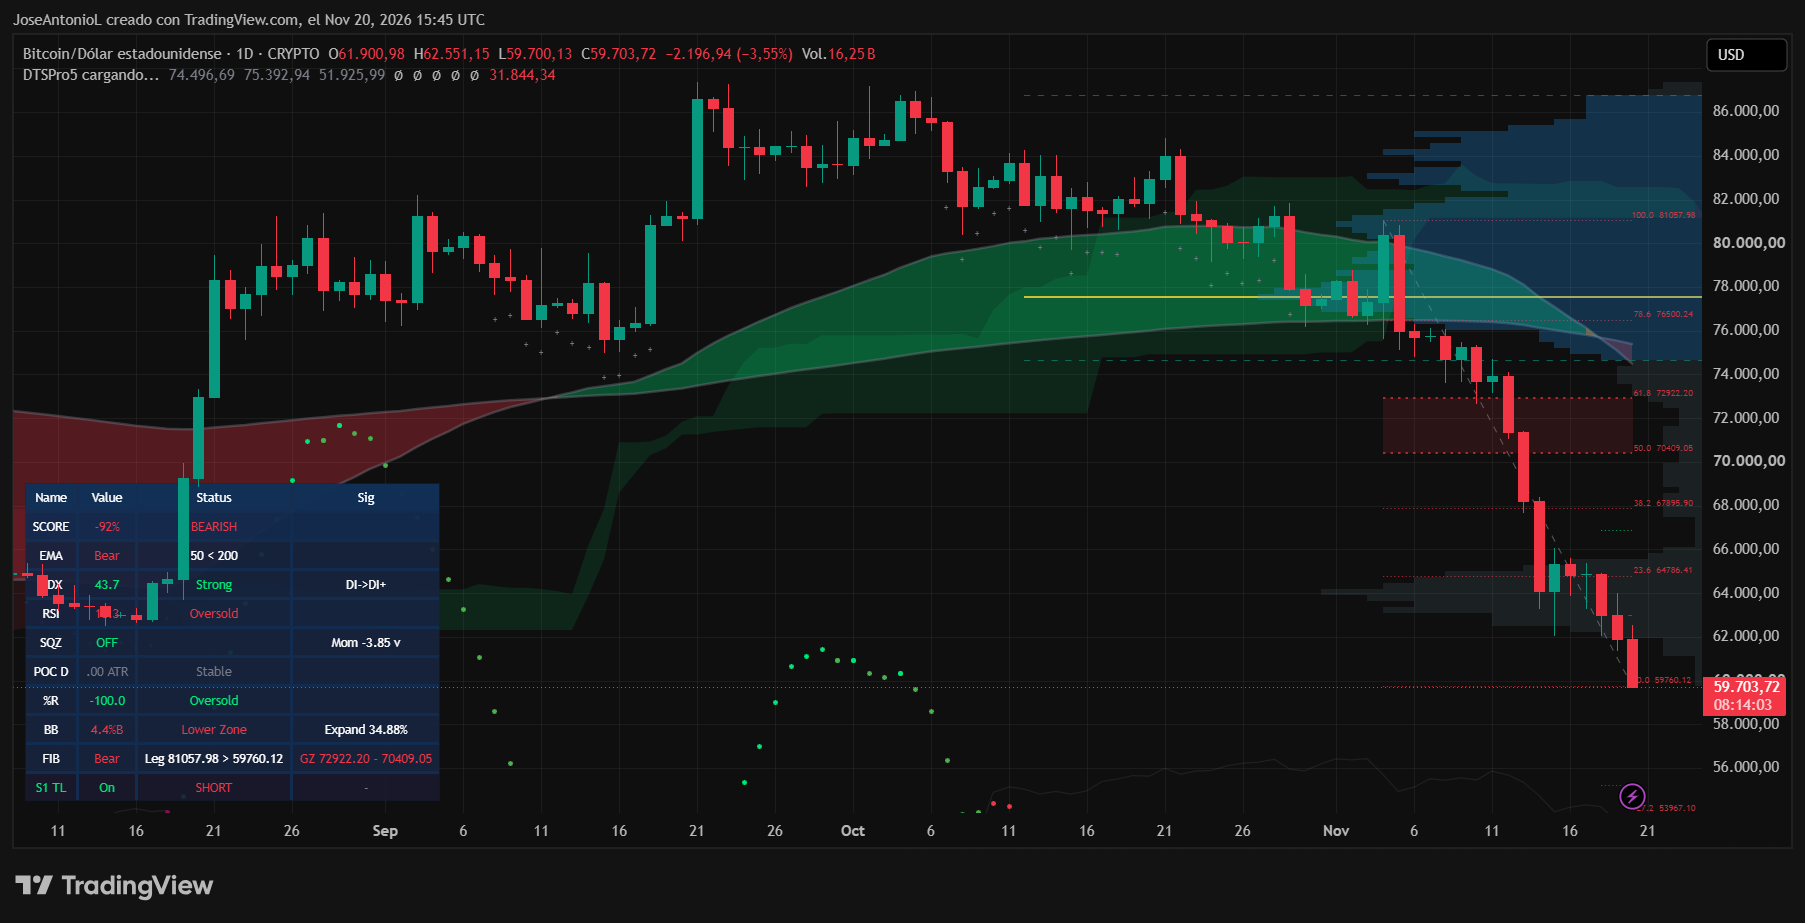
Selling extended across major crypto assets: Ethereum fell 4.24%, Solana 6.36%, BNB 4.38% and XRP 5.53% over the reported period. Decrypt also reported roughly $727 million in leveraged crypto liquidations over 24 hours, about 86% of them bullish positions. U.S. spot Bitcoin ETFs recorded $582.2 million in outflows on Thursday. Reported November outflows had reached roughly $2.9 billion by then, so the withdrawals had begun before Anthropic’s stock-market debut. The report also noted higher Treasury yields and expectations of tighter Federal Reserve policy; these concurrent developments do not establish a single cause for Bitcoin’s decline.
Reading the Bitcoin chart
On the reported daily chart, Bitcoin traded below both its 50-day and 200-day exponential moving averages, with the shorter average below the longer one. That configuration describes the prevailing downtrend; it is not a forecast. The relative strength index was in the teens, below the commonly used oversold threshold of 30, while the average directional index reached 43.7 and directional readings favored sellers. Neither an oversold reading nor a strong trend guarantees the next move.
The report identified roughly $58,000–$59,000, near the mid-2026 lows, as the next historical support area below $60,000. It placed other historical areas around $55,000–$56,000 and $50,000. On a rebound, it identified $60,000 as the first level to regain, followed by $62,000–$62,500, $65,000 and $68,000–$70,000. These are chart reference zones drawn from past trading, not price targets or assurances that buyers or sellers will appear there.