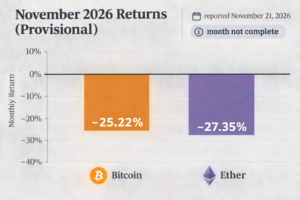
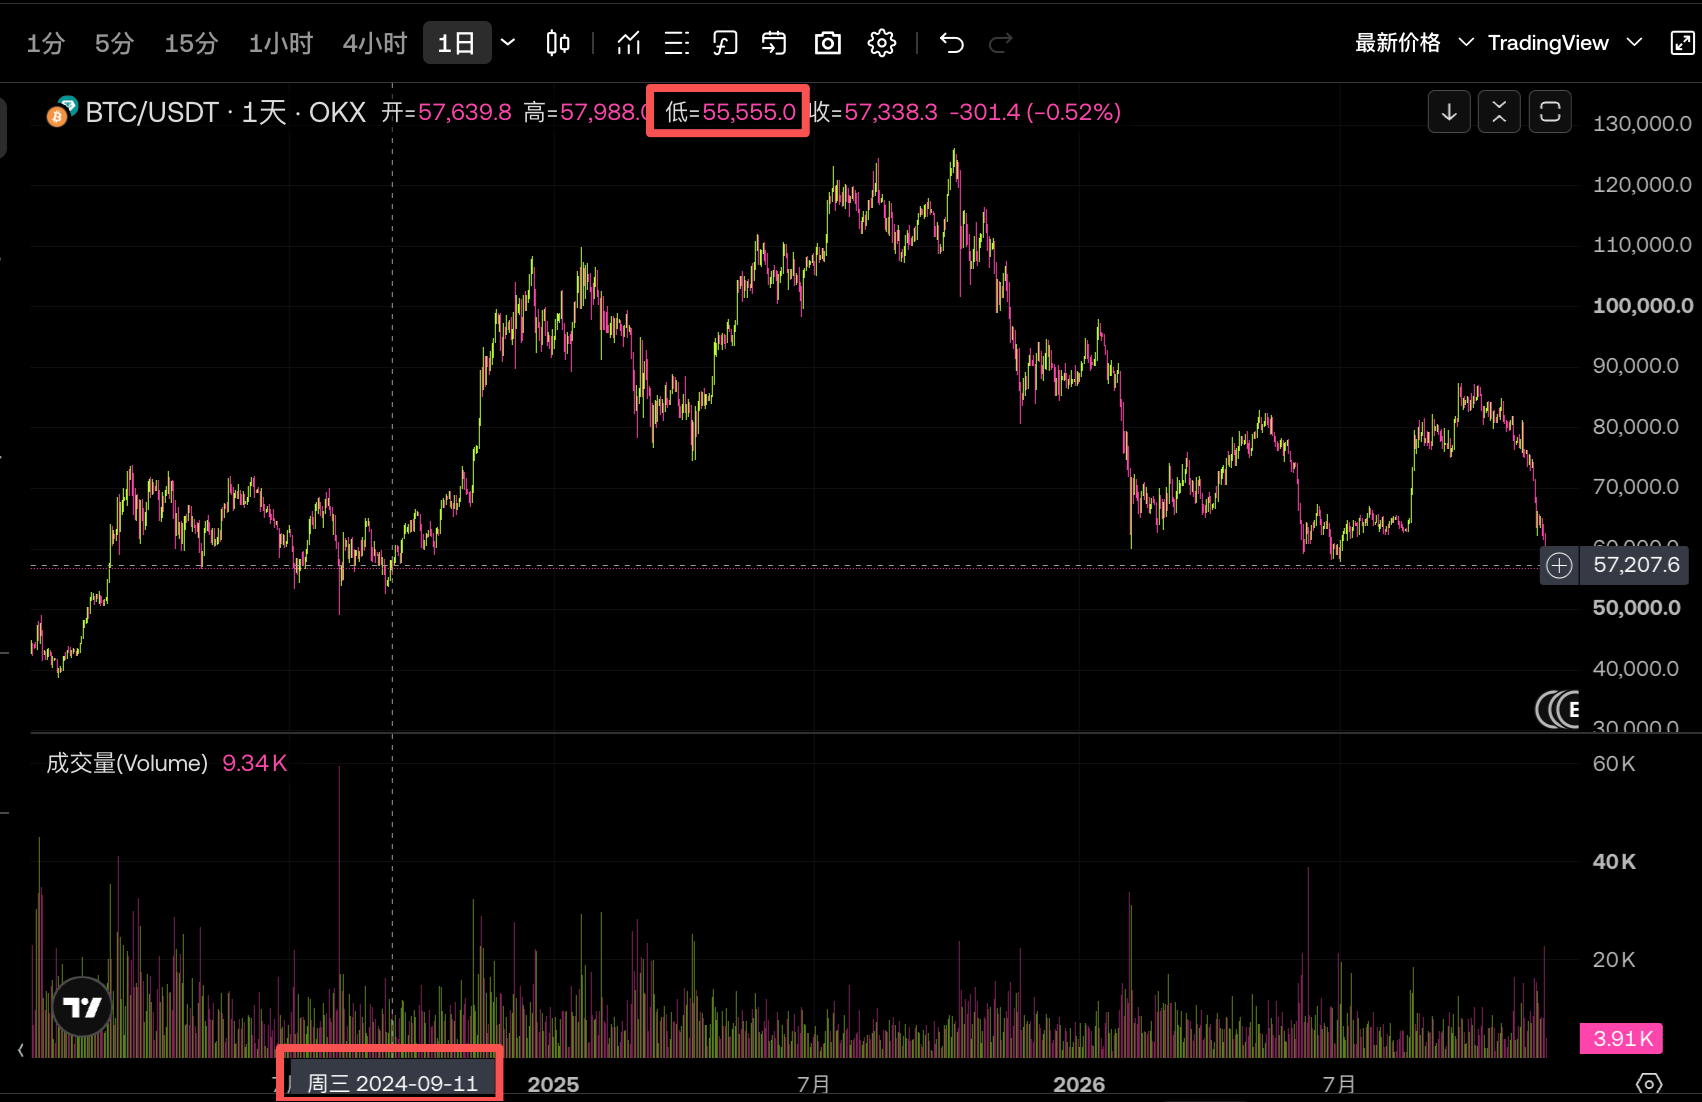
In its November 21, 2026 report, Odaily said Bitcoin had fallen below $56,000, touching $55,555.55. The article framed the decline as part of a broader sell-off across stocks, gold and crypto—not as a move explained by a Bitcoin valuation model alone.

What the reported data shows
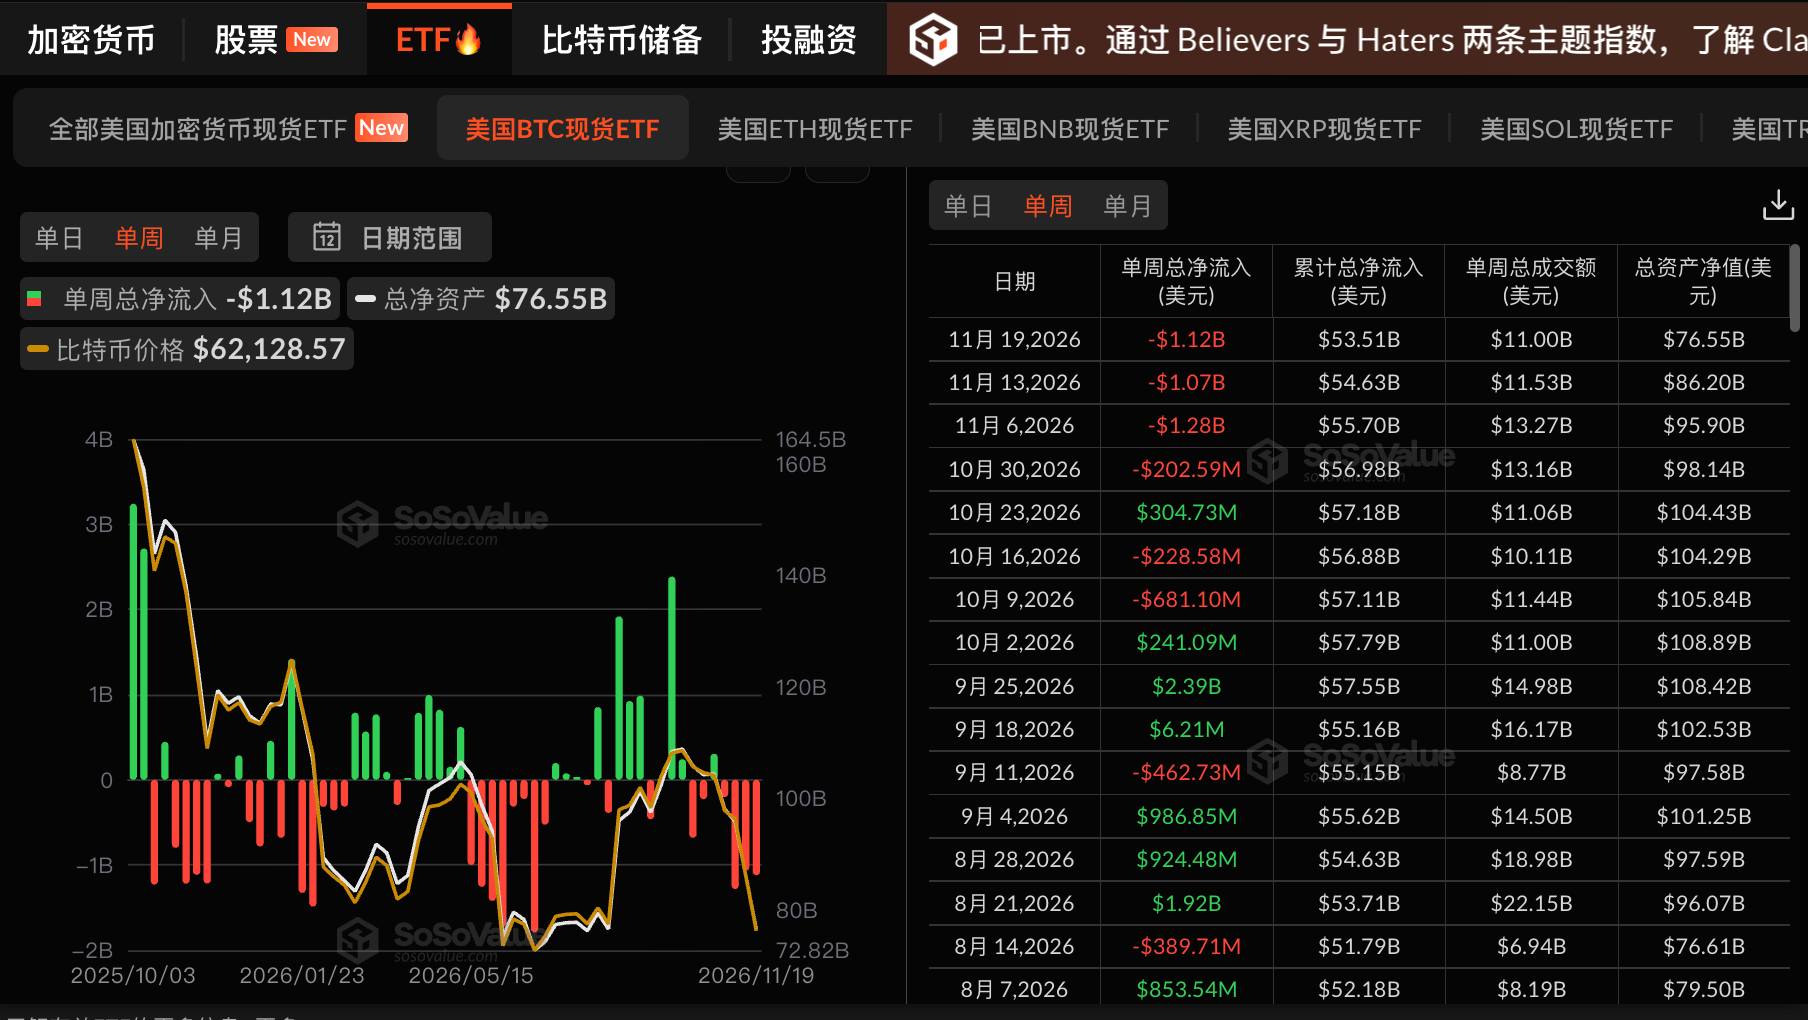
The article cited SoSoValue data showing $582.2 million in net outflows from US spot Bitcoin ETFs on November 19. It put the month’s net outflows through that date at about $3.47 billion, with roughly $1.12 billion leaving during the week. ETF flows measure activity in those funds; by themselves, they do not establish why Bitcoin’s price moved.
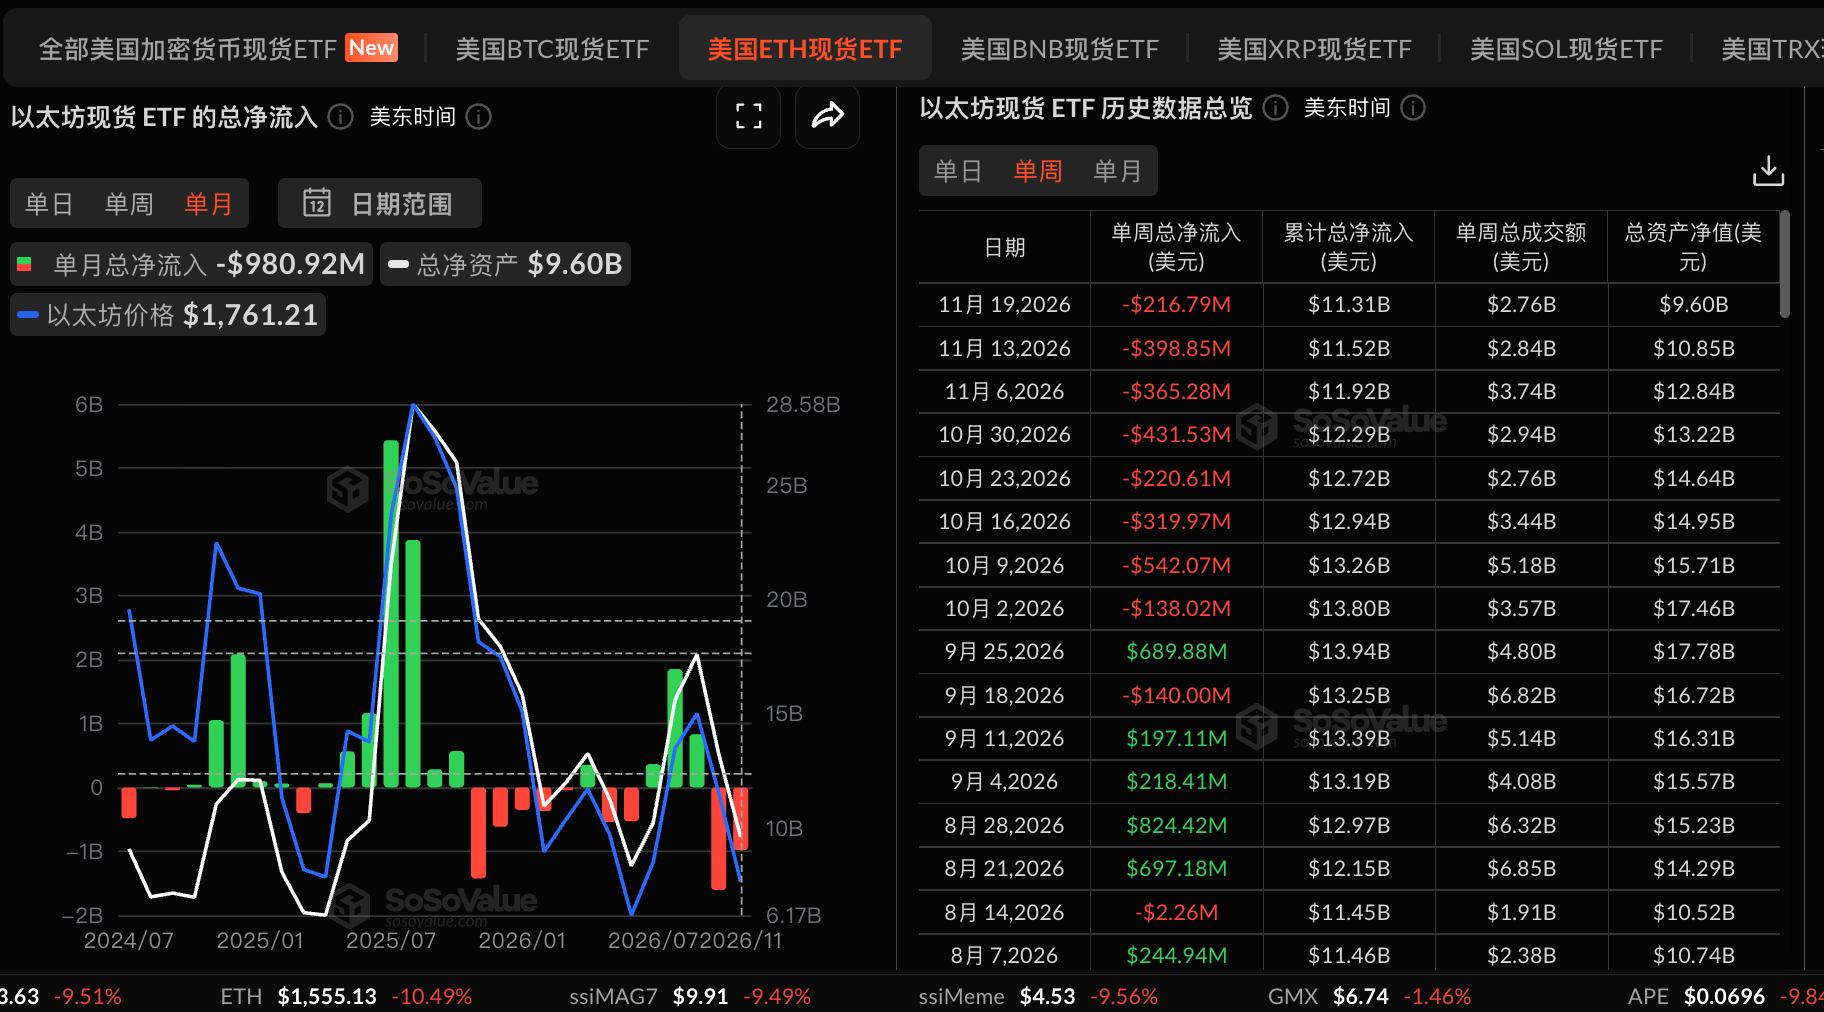
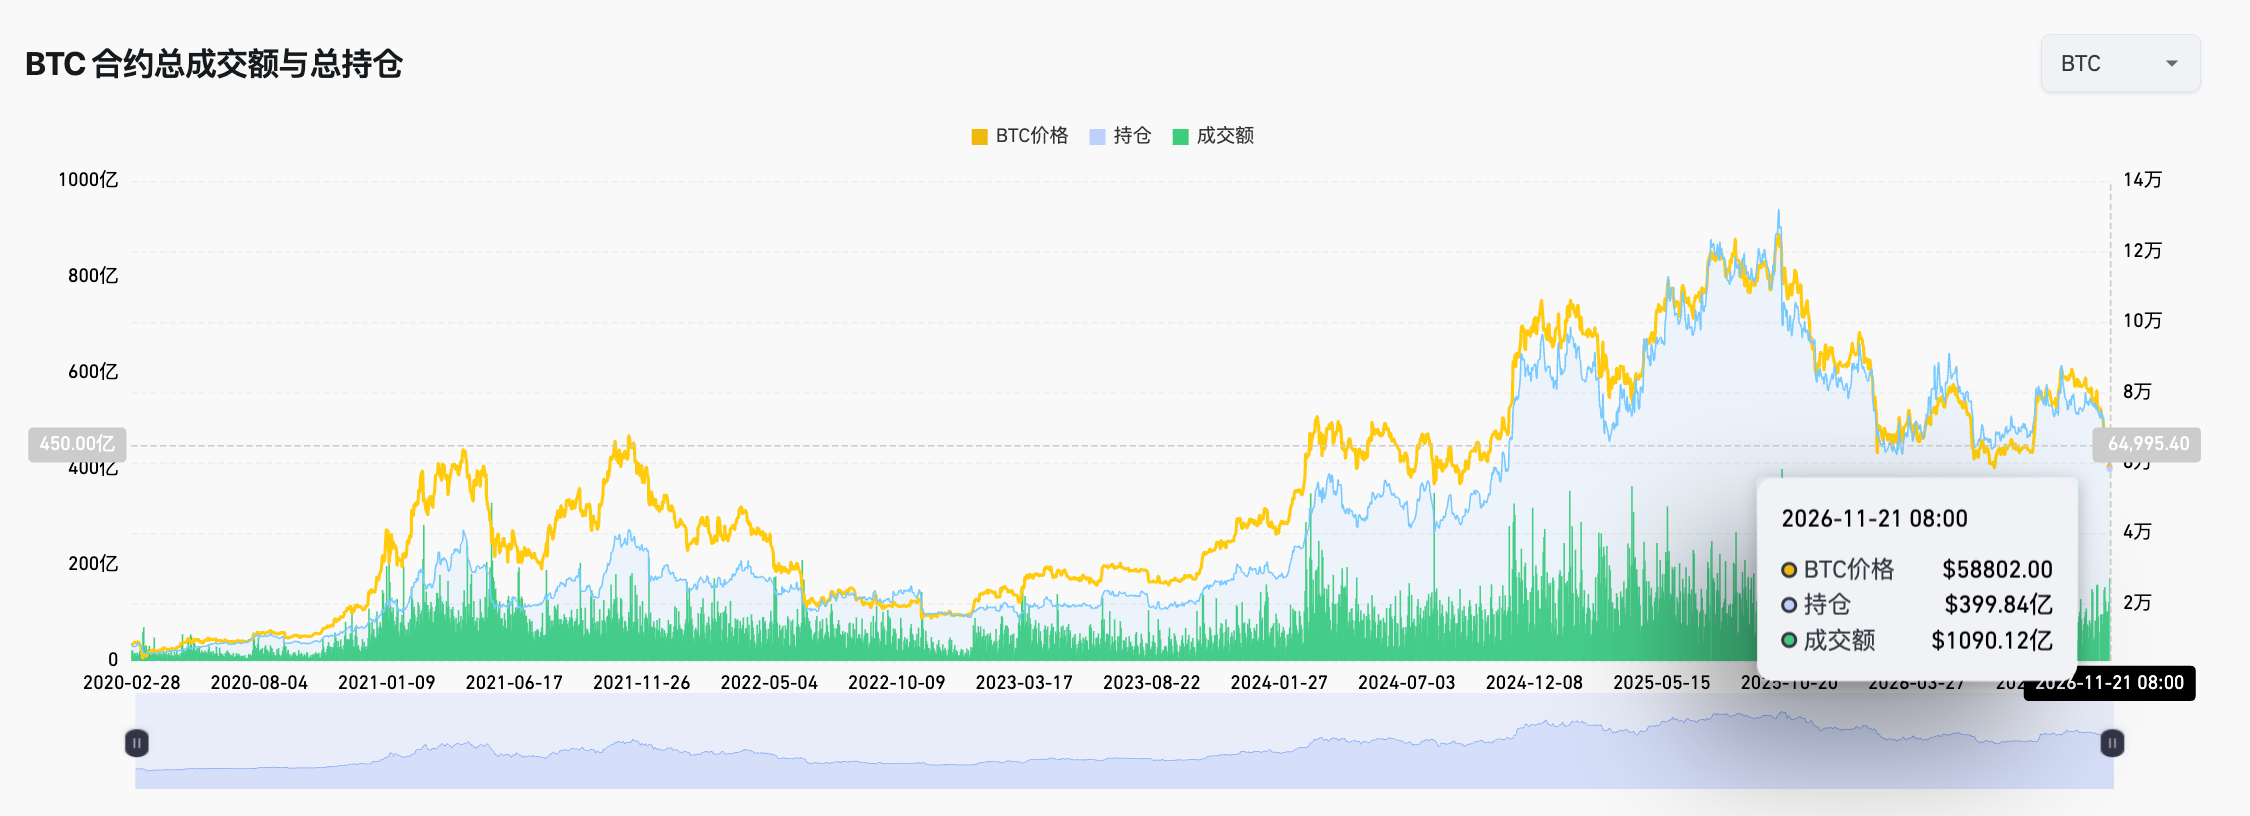
Citing Coinglass, Odaily reported more than $2.4 billion in crypto liquidations over the preceding 24 hours, including $2.239 billion in long positions. It put Bitcoin liquidations at $1.054 billion. The article also estimated that Bitcoin was about 53.8% below its October 2025 high and Ether about 67.5% below its August 2025 high. Those drawdowns describe the distance from past peaks, not a forecast of where either asset will trade next.

The macro explanation remains an interpretation
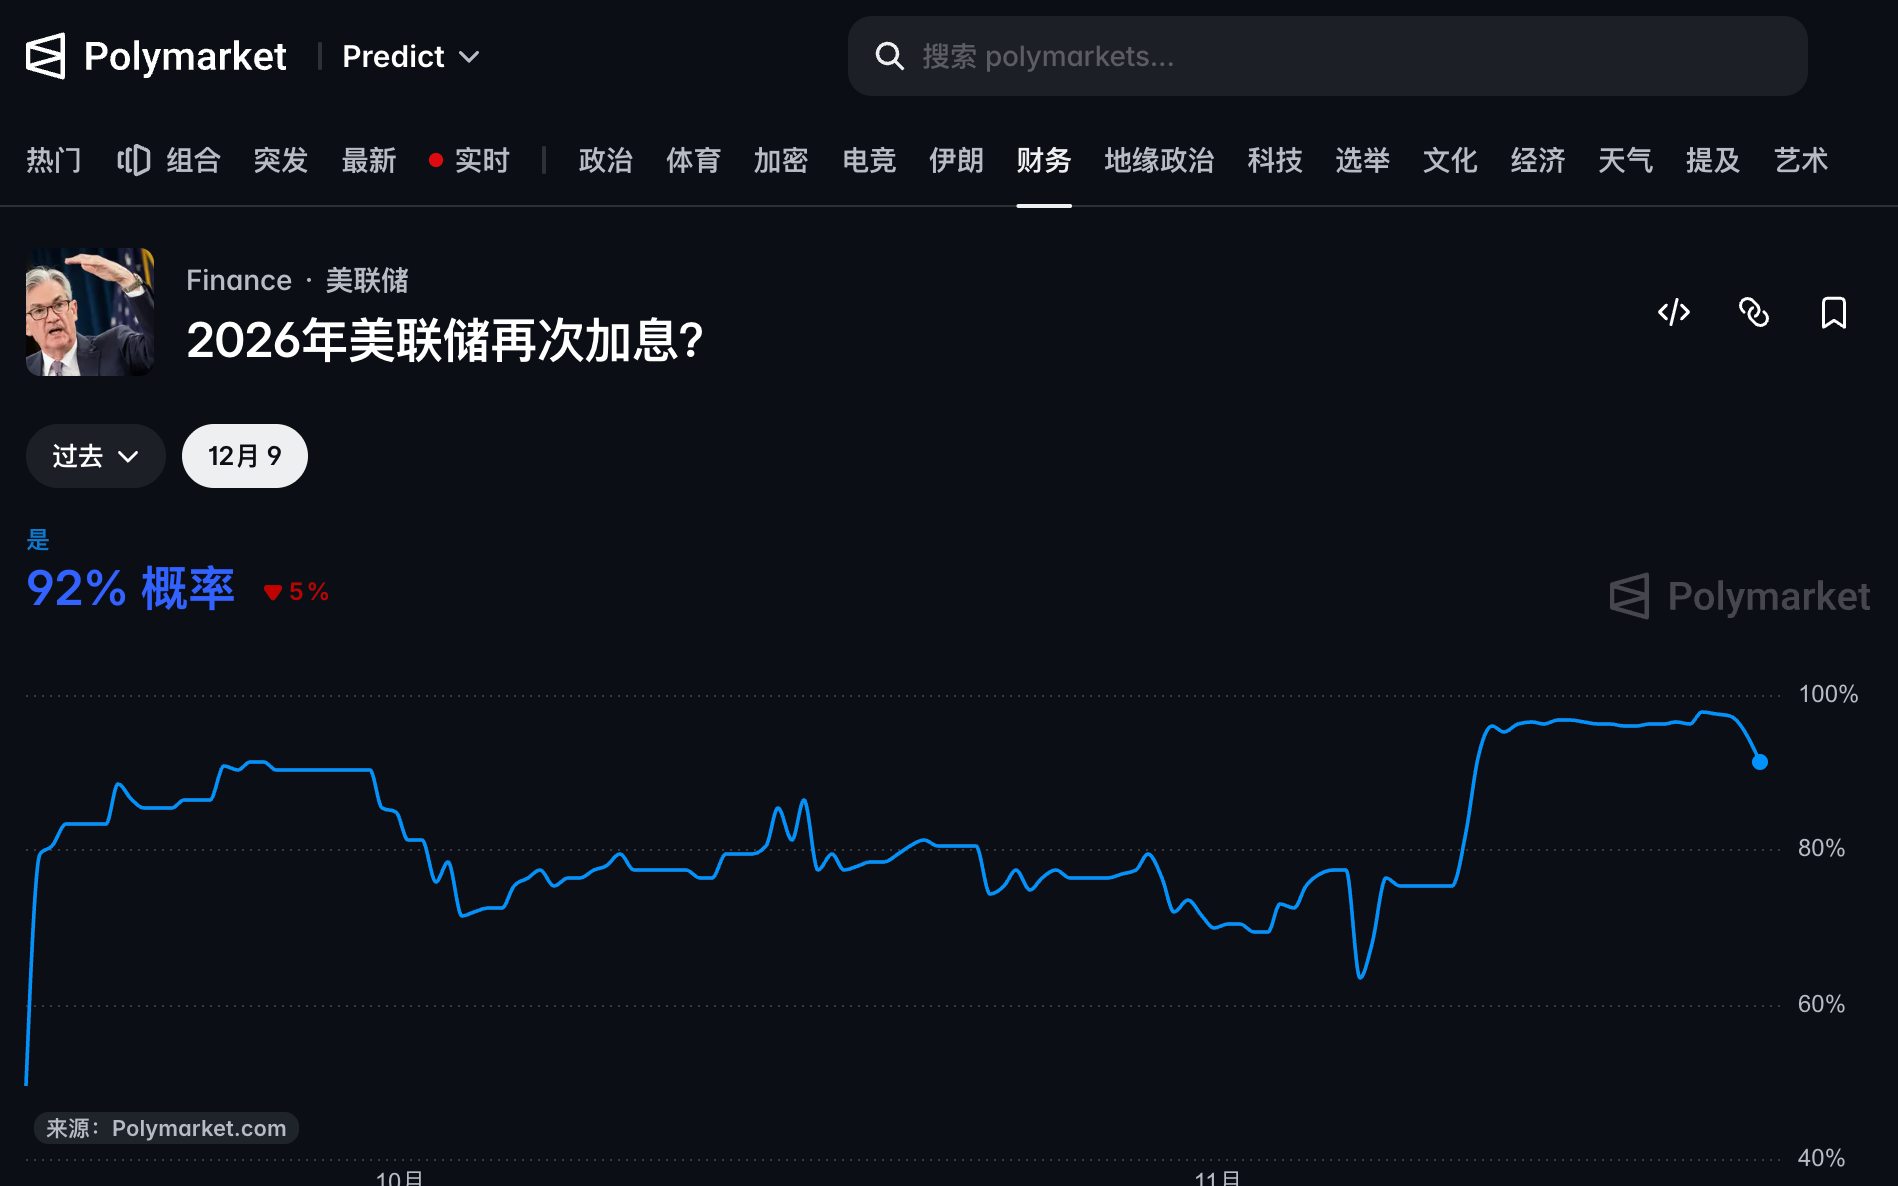
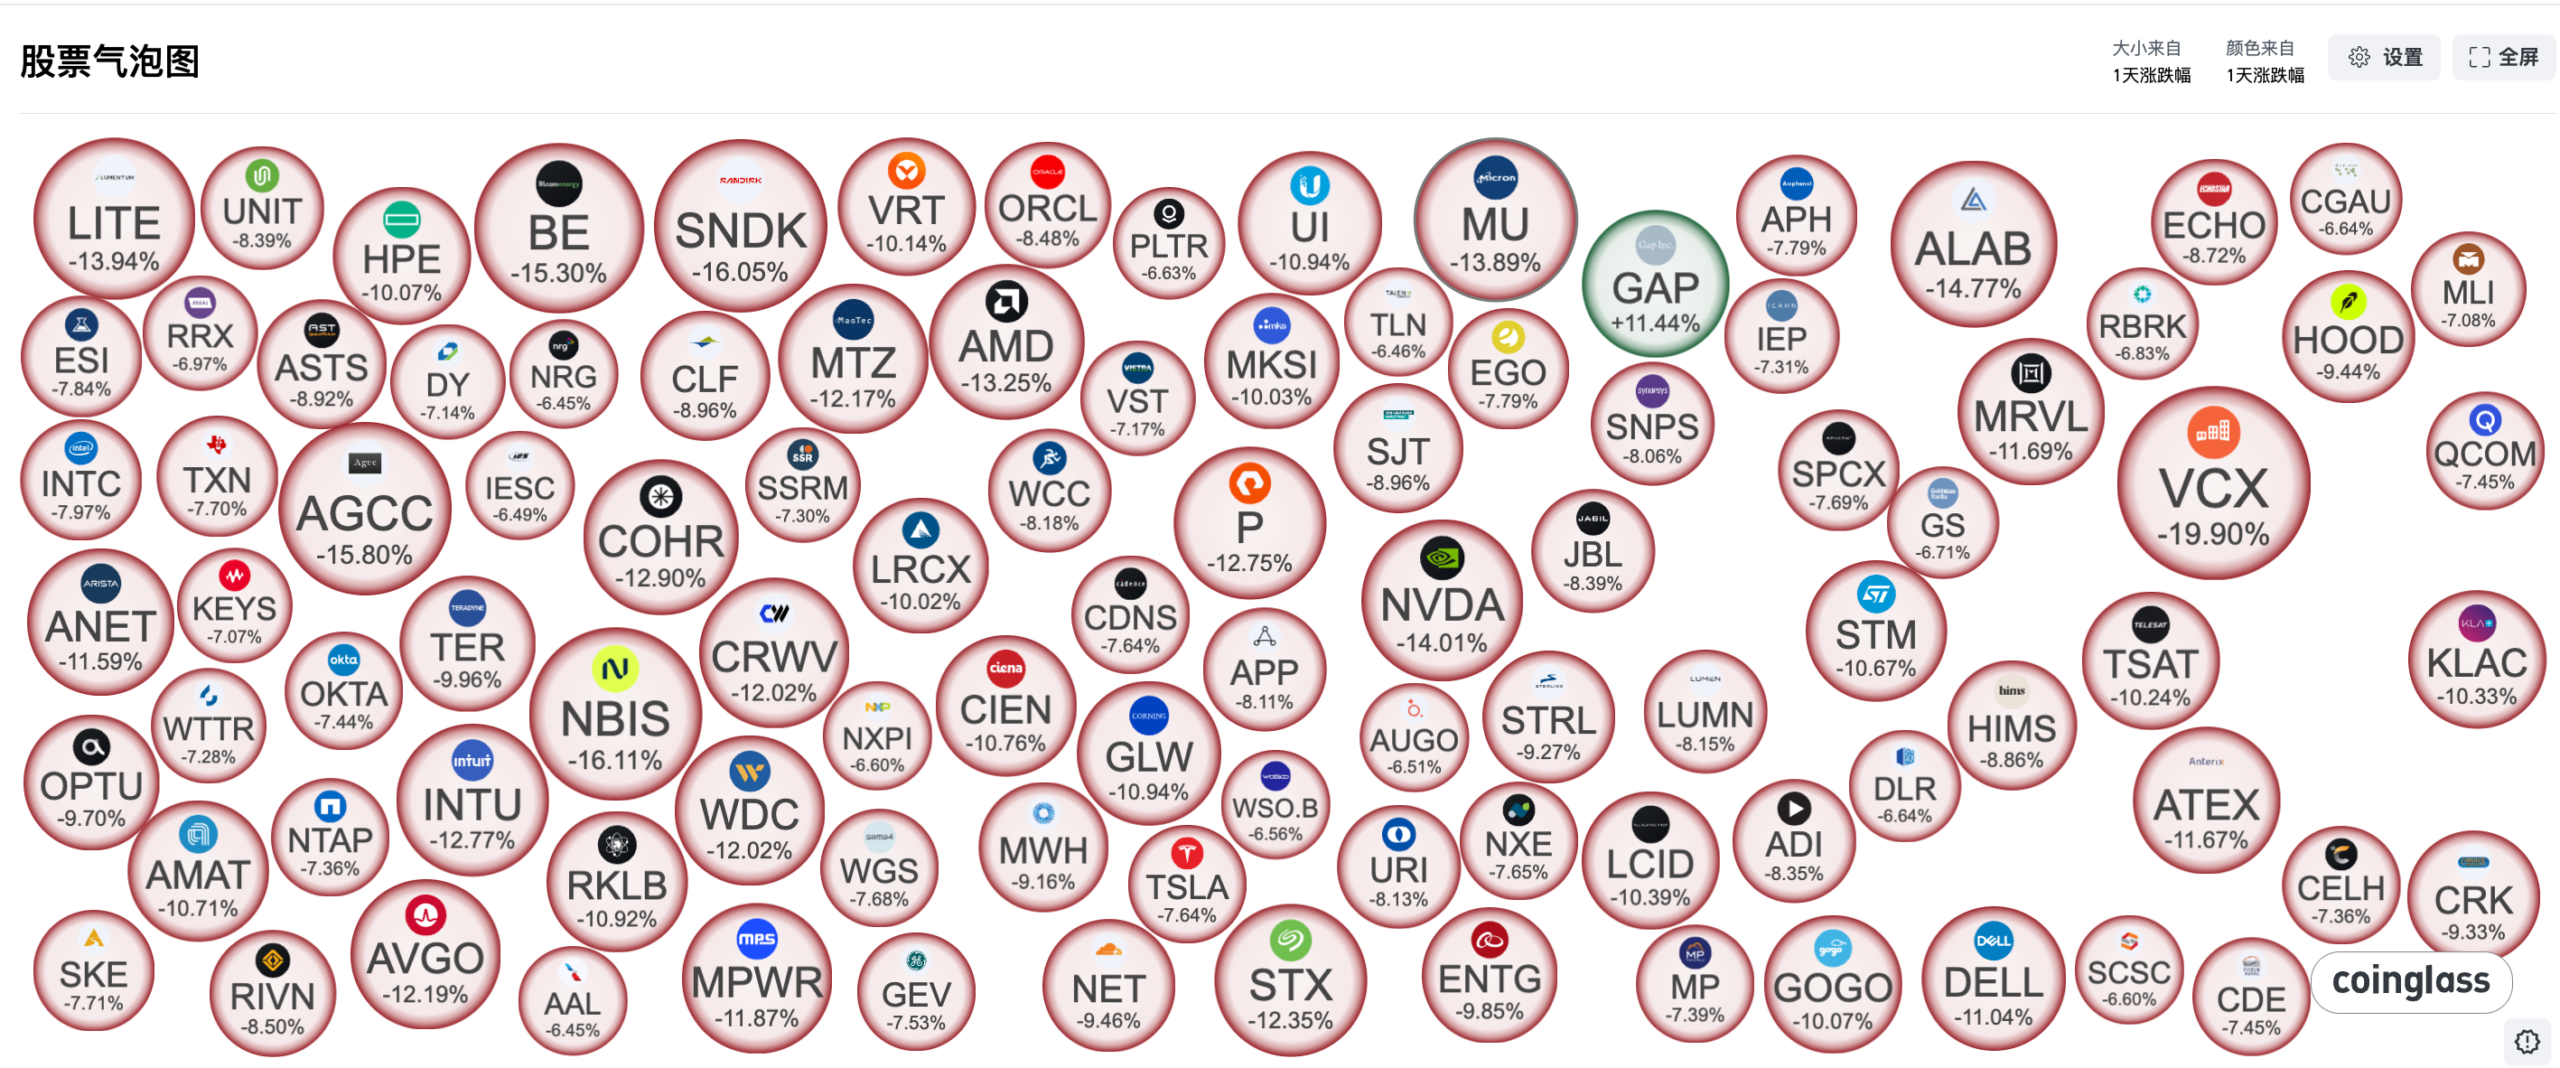
Odaily pointed to concern about further Federal Reserve rate increases and weakness in AI-related stocks. It reported that an October Federal Open Market Committee vote held rates steady, 10–2, while the two dissenters favored a 25-basis-point increase. The article also cited a Polymarket probability of 92% for a December rate increase. That market-implied probability is not a Fed decision.


Delphi Digital market strategist Scott Freeman characterized the simultaneous pressure on Bitcoin, AI stocks and gold as a liquidity problem. That is an explanation offered by a named analyst, not proof that one factor caused every decline. For readers using historical Bitcoin price bands or cycle models, the reported ETF outflows, liquidations and cross-market moves are relevant context that a price-history chart alone cannot explain.