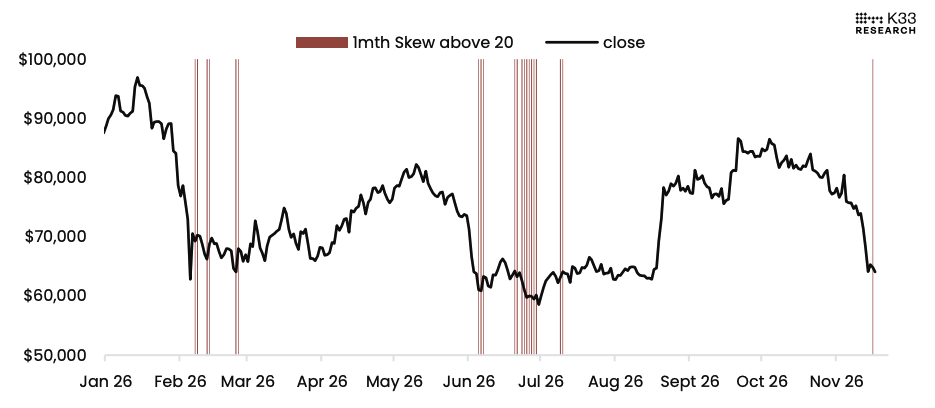
K33’s chart compares Bitcoin’s price with the one-month, 25-delta options skew. The skew reflects demand for downside protection; the chart marks periods when it rose above 20. Those historical episodes can provide context, but they do not establish that a price recovery will follow.
In reporting on November 18, 2026, K33 research head Vetle Lunde said Bitcoin showed signs of a local bottom after six consecutive weeks of declines. He considered prices below $70,000 attractive to medium- and long-term investors.
Lunde pointed to several measures of the sell-off: Bitcoin’s daily RSI had fallen to 19.95 on the preceding Saturday and had remained below 25 since Friday. The price had briefly traded about 8.5% below its 200-week moving average, while roughly 51.5% of circulating Bitcoin was at a loss.
K33 said demand for downside protection had pushed the one-month, 25-delta skew above 20 for the first time since July. It noted that similar readings had historically coincided with selling exhaustion near local bottoms. Lunde cautioned, however, that recoveries from comparable levels had sometimes involved prolonged consolidation: any recovery could be uneven rather than an immediate rebound.