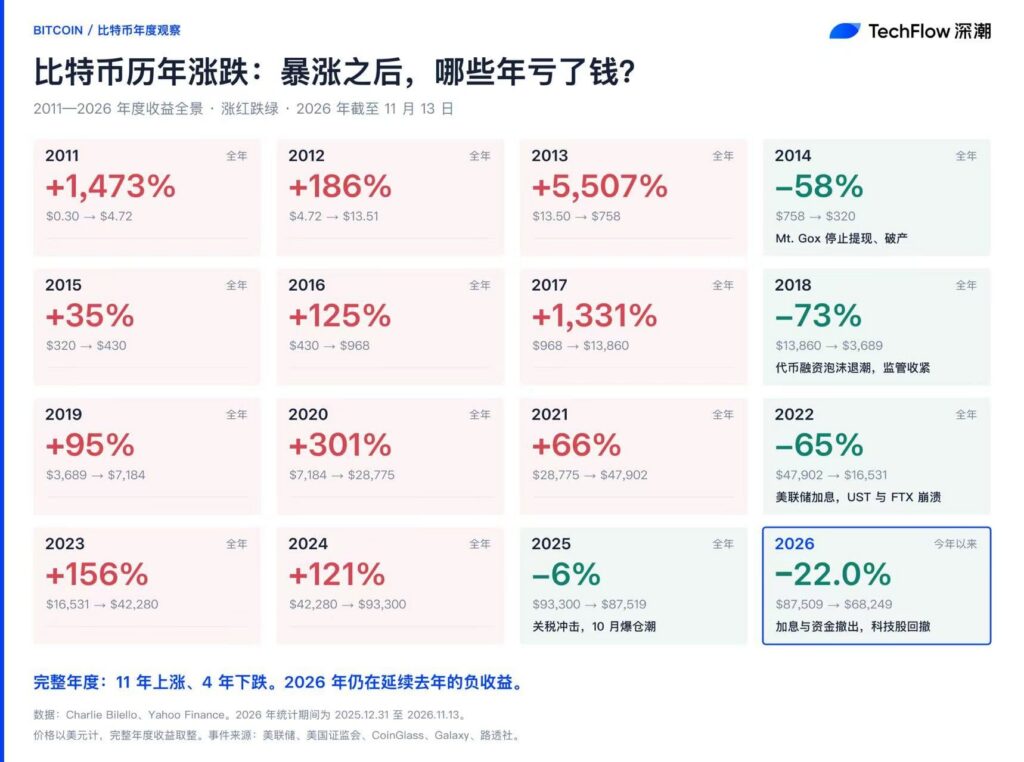
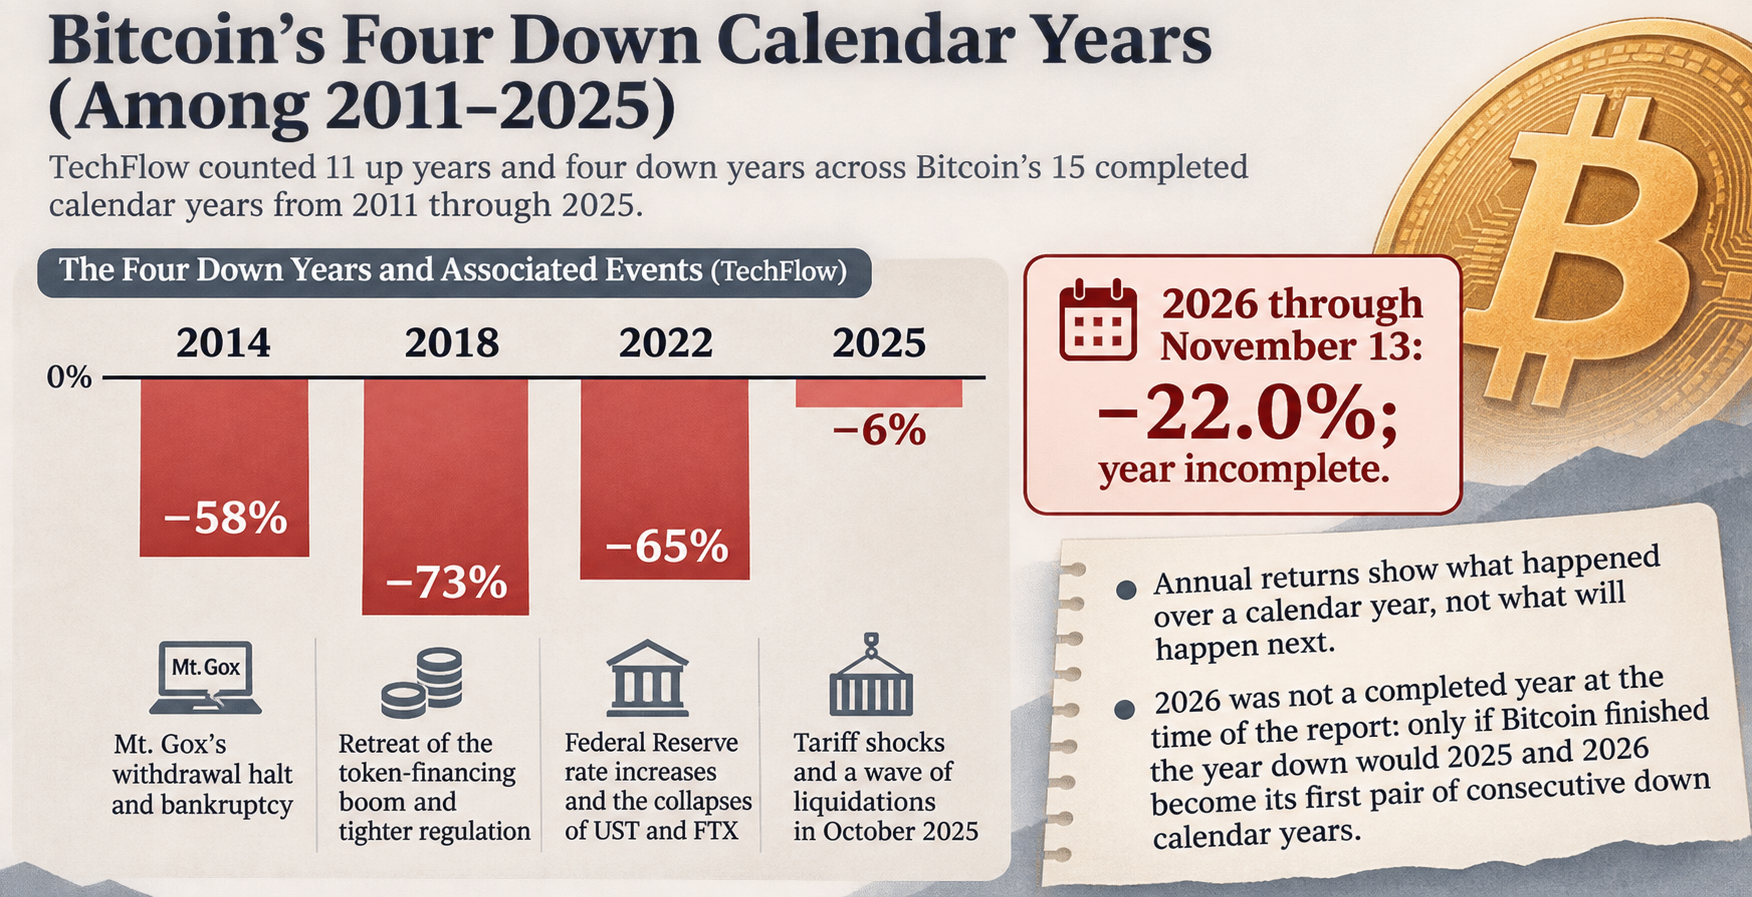
Annual returns show what happened over a calendar year, not what will happen next. In a November 16, 2026 report, TechFlow counted 11 up years and four down years across Bitcoin’s 15 completed calendar years from 2011 through 2025.
The four down years were 2014 (−58%), 2018 (−73%), 2022 (−65%) and 2025 (−6%). TechFlow associated them, respectively, with Mt. Gox’s withdrawal halt and bankruptcy; the retreat of the token-financing boom and tighter regulation; Federal Reserve rate increases and the collapses of UST and FTX; and tariff shocks and a wave of liquidations in October 2025. Those associations do not, on their own, establish how much each event contributed to the annual return.
The largest gains in TechFlow’s figures were 5,507% in 2013, 1,473% in 2011 and 1,331% in 2017. That wide range is a reminder of the limits of treating a historical average or a cycle pattern as a forecast.
For 2026, TechFlow reported that Bitcoin had fallen from $87,509 to $68,249 as of November 13, a year-to-date decline of 22.0%. It cited rate increases, capital outflows and a technology-stock pullback as influences. 2026 was not a completed year at the time of the report: only if Bitcoin finished the year down would 2025 and 2026 become its first pair of consecutive down calendar years.