
Bitcoin’s price chart showed a six-week retreat, not a reason for it. In reporting published on November 19, 2026, at 03:16 UTC+8, Bitcoin had fallen toward $63,000 on Wednesday and was approaching $62,000, down 3.8% for the session. The decline coincided with Anthropic’s planned share pricing, but timing alone cannot show that IPO buyers were selling Bitcoin.
Anthropic expected to price its shares on Wednesday at an indicated $70–$78, ahead of a planned Thursday Nasdaq debut under the ticker ANT. Its prospectus indicated a potential $1.4 trillion valuation. Kraken chief economist Thomas Perfumo told MarketWatch the offering could draw capital from risk assets. Binance founder Changpeng Zhao also identified it as one possible factor in Bitcoin’s decline—not an established cause.
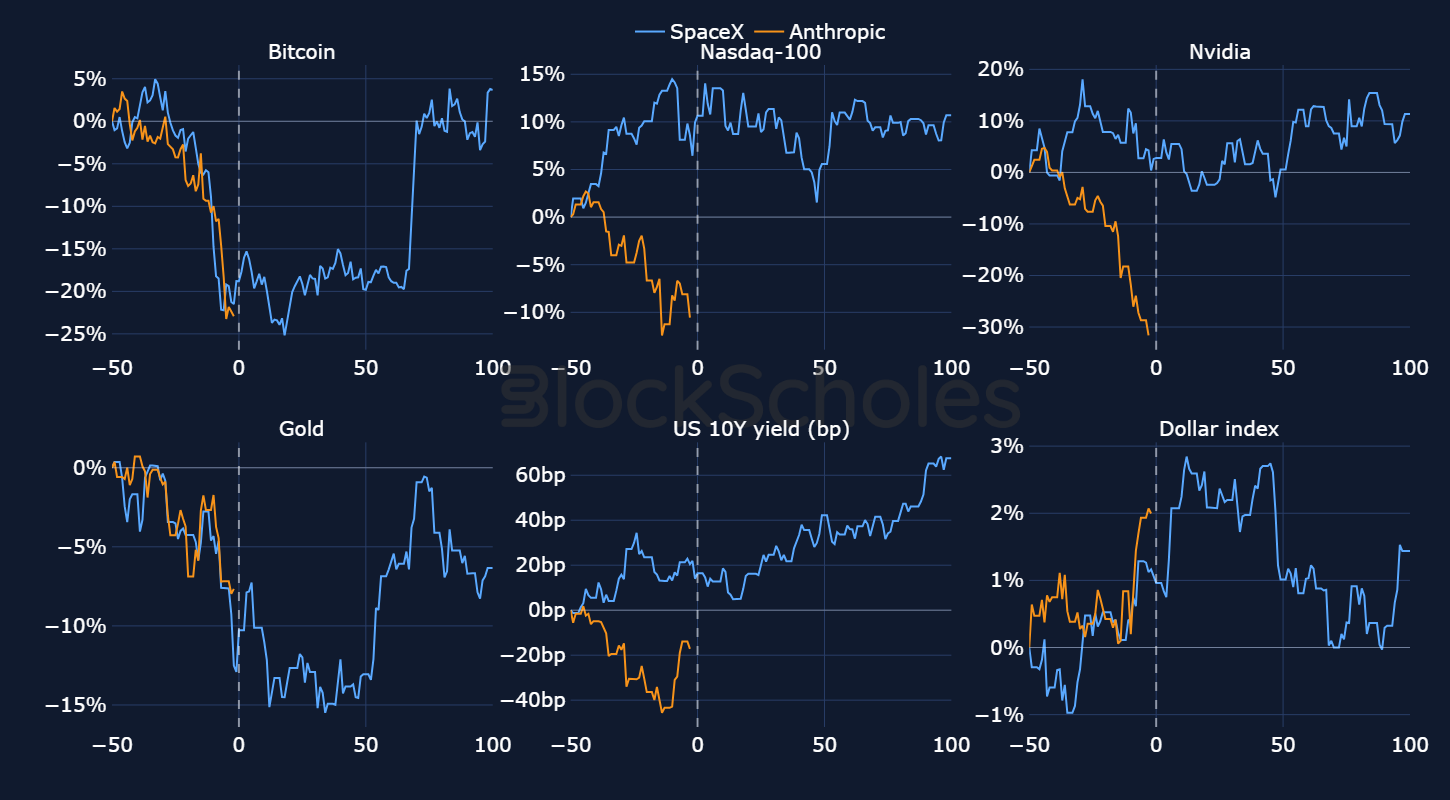
The comparison has a missing piece
Bitcoin fell 23% in the 50 days before Anthropic’s planned listing, compared with 19% over the equivalent period before SpaceX listed in June. But Block Scholes analyst Thahbib Rahman noted that AI shares had rallied before SpaceX’s listing and were falling this time. Over the preceding 50 days, Nvidia was down 32% and the Nasdaq was down 11%.
Bitcoin’s 30-day correlation with Nvidia rose from 0.20 to 0.56, while its correlation with gold fell from 0.63 to 0.39. Those figures describe recent co-movement; they do not identify what caused the selling or establish a lasting change in Bitcoin’s relationship with either asset. Rahman’s interpretation was that liquidity was moving out of crypto and equities together.
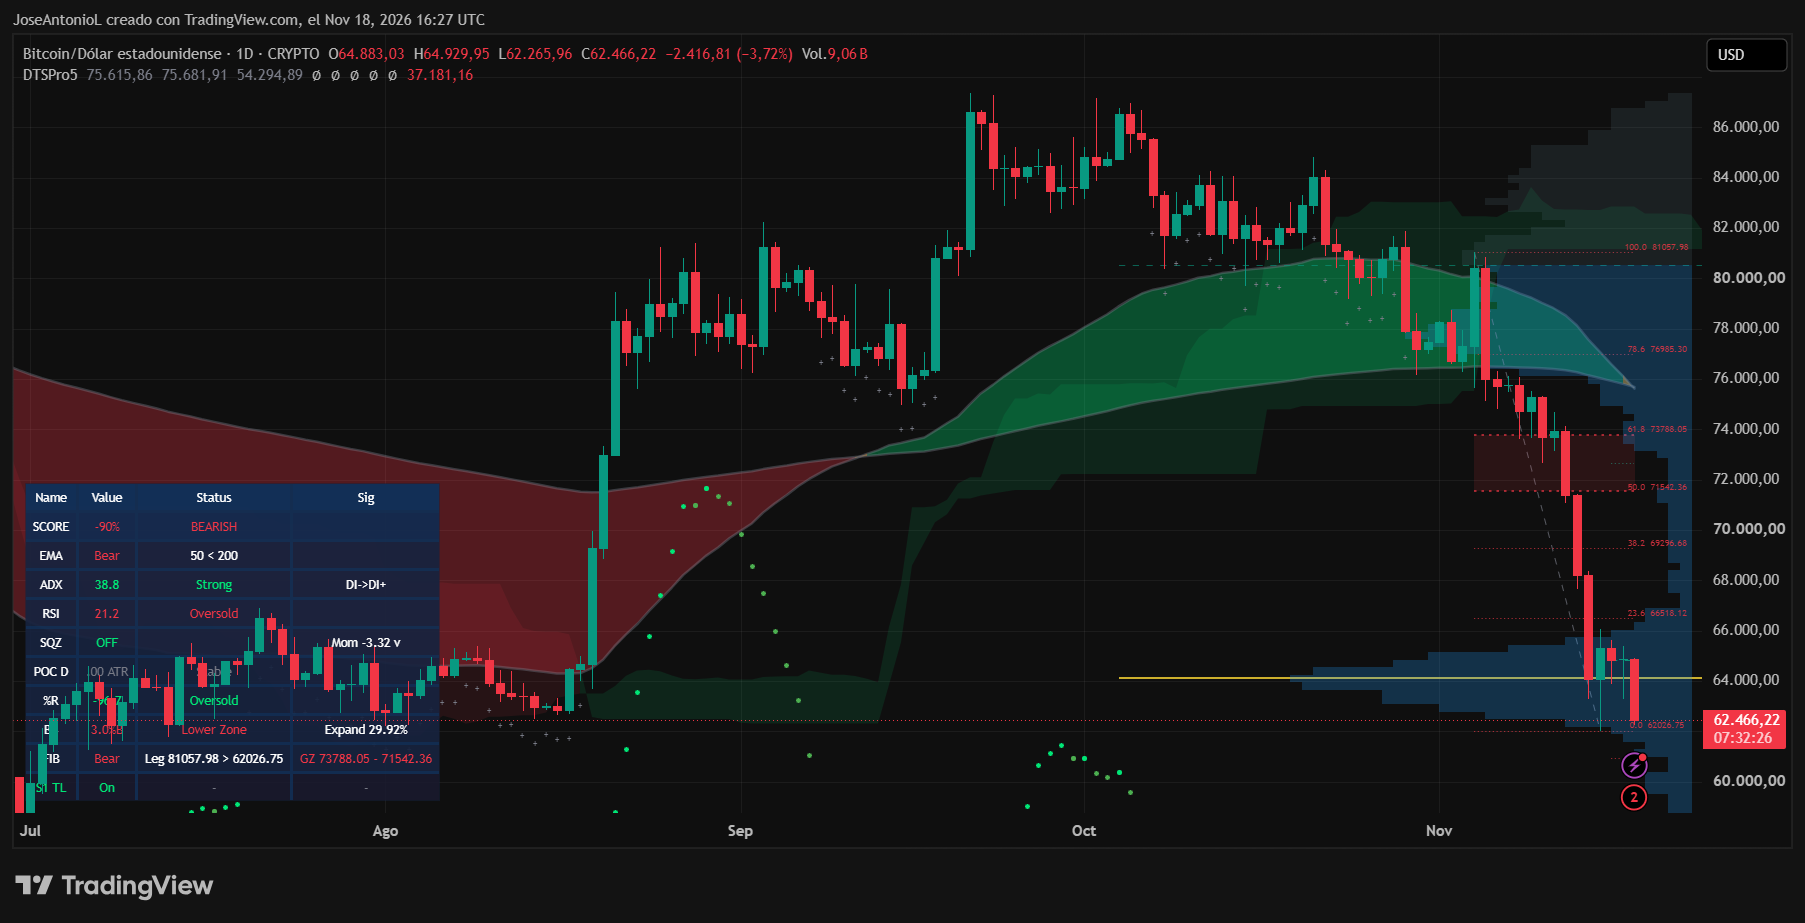
What Bitcoin’s indicators showed
The daily-chart relative strength index stood at 21.8, below the commonly used oversold threshold of 30. The average directional index was 38.7, indicating a strong trend—downward in this case. Bitcoin’s 50-day exponential moving average was also below its 200-day average, a bearish configuration often called a death cross. These are readings of price history, not forecasts: oversold conditions can persist, and moving-average signals lag.
The report placed an immediate price area near $62,000, close to Sunday’s low. Glassnode data showed buyers absorbed 66,000 BTC between $62,000 and $66,000 during heavy selling, although stablecoin supply had shrunk 4.2% over 90 days. It identified $60,000 as the next psychological level below $62,000, with resistance near $65,500, $69,300 and $73,700. These levels describe the chart at the time of reporting, not guaranteed support or targets.
There was also recorded selling pressure beyond the IPO theory. U.S. spot Bitcoin ETFs had $239.9 million in outflows on Tuesday, including $209.5 million from BlackRock’s IBIT. Nearly $2 billion in leveraged crypto positions were liquidated during the weekend decline. Hilbert Group portfolio manager Jesse Marre characterized the selloff as a stop-loss run and argued that derivatives traders had already capitulated. The report also cited rising Treasury yields, a stronger dollar and renewed expectations of Federal Reserve rate hikes as potential pressure on speculative assets.
BitMEX co-founder Arthur Hayes framed Anthropic’s debut as a possible gauge of broader risk appetite rather than simply a drain on Bitcoin: he said a strong debut could coincide with Bitcoin rising, while a weak one could deepen pressure. At publication, the IPO had not yet debuted, and neither that view nor the price indicators established what Bitcoin would do next.