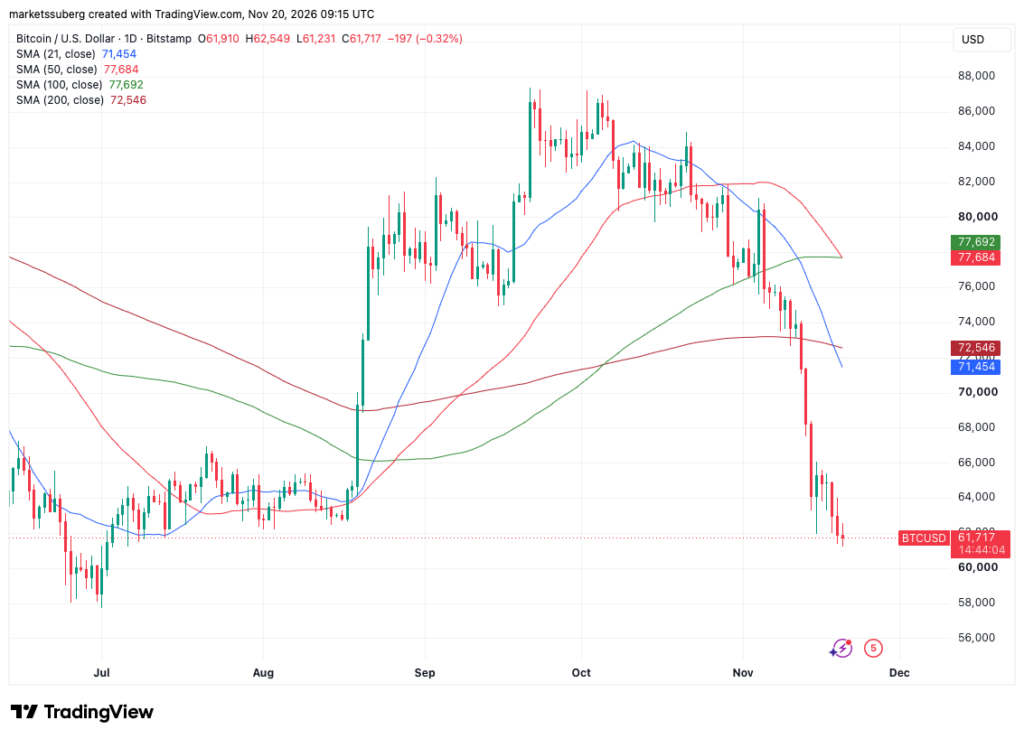
A daily moving-average chart smooths Bitcoin’s price over different periods; it does not predict where price will go next. In reporting published on November 20, 2026, Material Indicators co-founder Keith Alan pointed to a crossover resembling one seen in 2023: Bitcoin’s 21-day simple moving average had fallen below its 200-day average.
In an analysis dated November 19, Alan expected the 50-day average to fall below the 100-day average before the end of that week. A Bitstamp daily-chart snapshot cited by Cointelegraph at 17:15 Beijing time on November 20 showed the 50-day average at about $77,684, just below the 100-day average at $77,692.
Similar pairs of crosses appeared in August–September 2023. Bitcoin subsequently retested support around $25,000 on September 11. Alan cautioned that a single historical example cannot establish a reliable pattern or justify expecting a similar-sized move, even though he saw similarities in the timing, position and candlestick characteristics of the two episodes. The comparison describes a past chart pattern, not a price target.