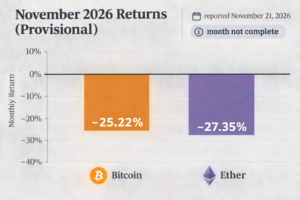
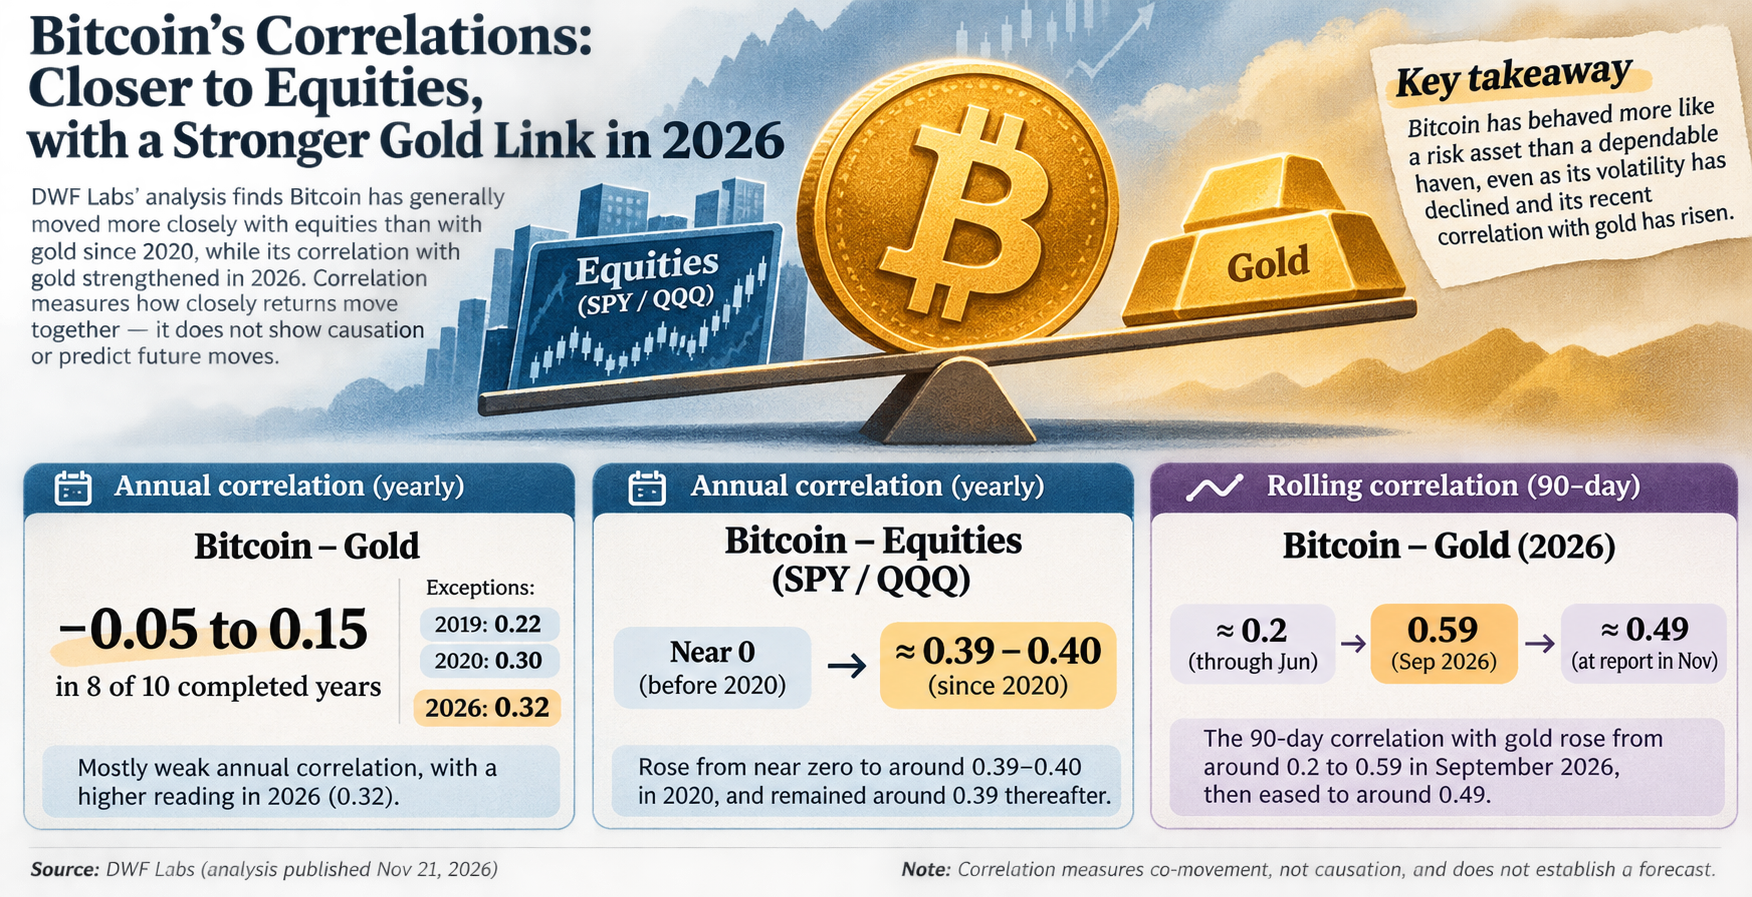
Correlation measures how closely two assets’ returns move together; it does not show that one causes the other to move, or predict what either will do next. In an analysis published on November 21, 2026, DWF Labs found that Bitcoin had generally moved more closely with equities than with gold since 2020—though its relationship with gold had strengthened in 2026.
Equities have been the more consistent comparison
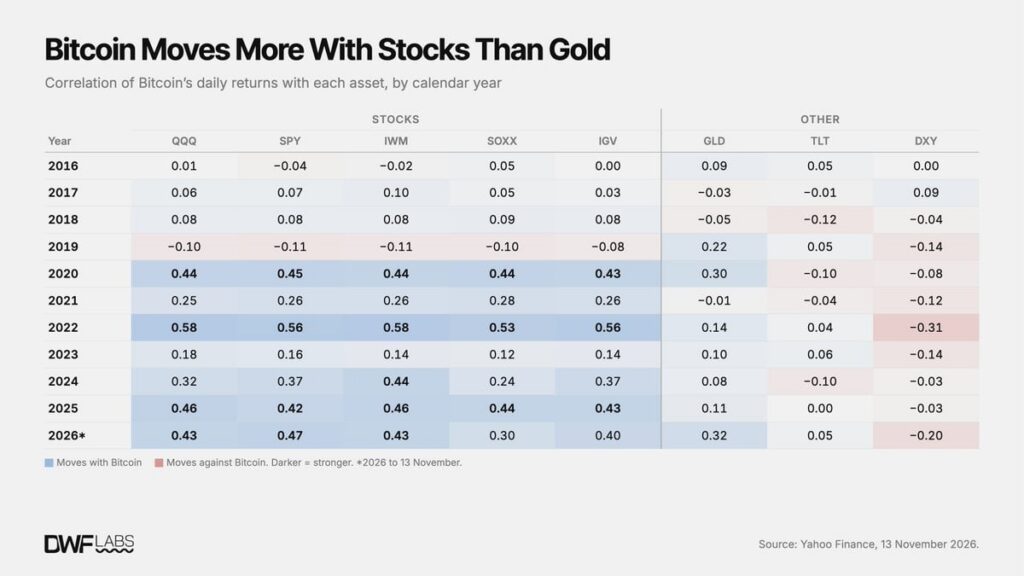
From 2016 through 2019, Bitcoin’s annual correlations with stocks, gold, US Treasuries and the dollar were weak, ranging from −0.14 to 0.22. Across the ten completed years covered by the analysis, its correlation with gold was between −0.05 and 0.15 in eight years. The exceptions were 2019, at 0.22, and 2020, at 0.30. The 2026 figure stood at 0.32 when the analysis was published.
Bitcoin’s correlations with the S&P 500 proxy SPY and Nasdaq-100 proxy QQQ, by contrast, rose from near zero before 2020 to around 0.39–0.40 in 2020 and remained around 0.39 thereafter, according to DWF Labs. A correlation of 0.4 is moderate: squared, it suggests that stock moves account for roughly one-sixth of the variation in Bitcoin’s daily returns under this simple comparison. The relationship also changed with market conditions. DWF Labs reported that Bitcoin’s 90-day stock correlation reached 0.65 in May 2022.
On days when the Nasdaq fell at least 1%, Bitcoin also fell on 74% of such days from 2020 until the launch of spot ETFs and on 77% afterward, with an average decline of 2.0%, the analysis found. Gold fell on 57% of those days, by an average of 0.2%. These observations challenge a consistent safe-haven interpretation; they do not establish how Bitcoin must behave in a future sell-off.
Gold correlation rose, while volatility remained substantial
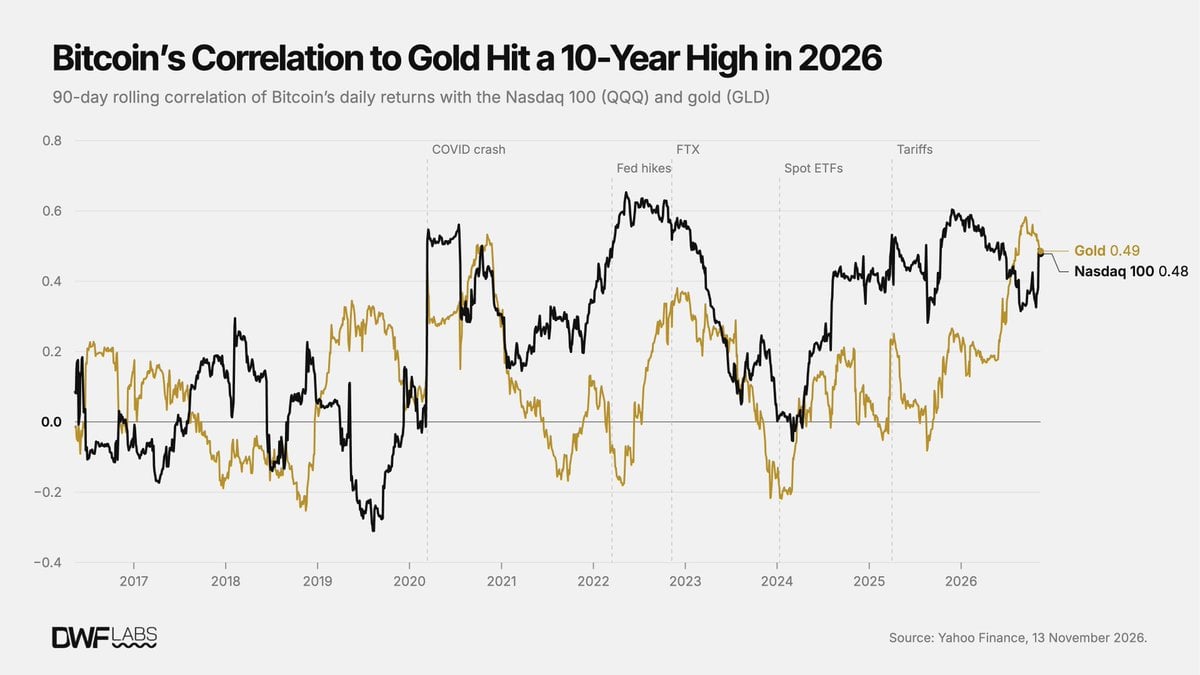
Bitcoin’s 90-day correlation with gold was around 0.2 through June 2026, then reached 0.59 in September—above its correlation with the Nasdaq at that point, which DWF Labs put at 0.34. At the time of the November report, the gold correlation was around 0.49, roughly level with the Nasdaq correlation. A stronger rolling correlation is a description of that period, not proof of a lasting change in Bitcoin’s monetary role.
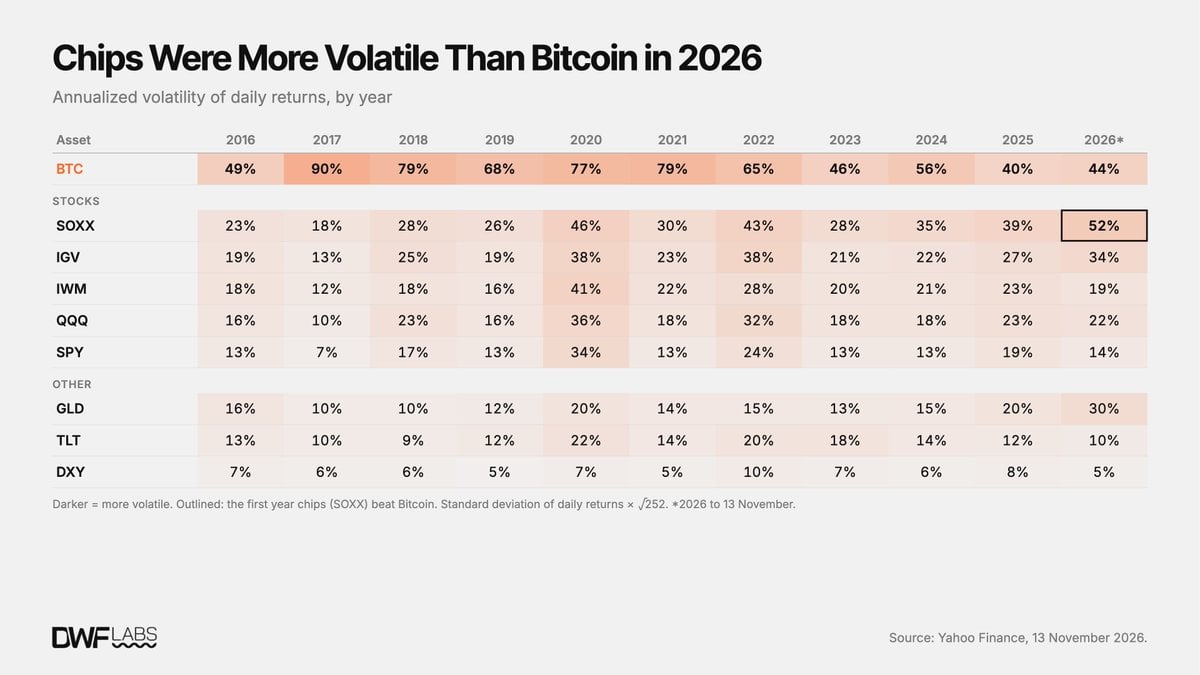
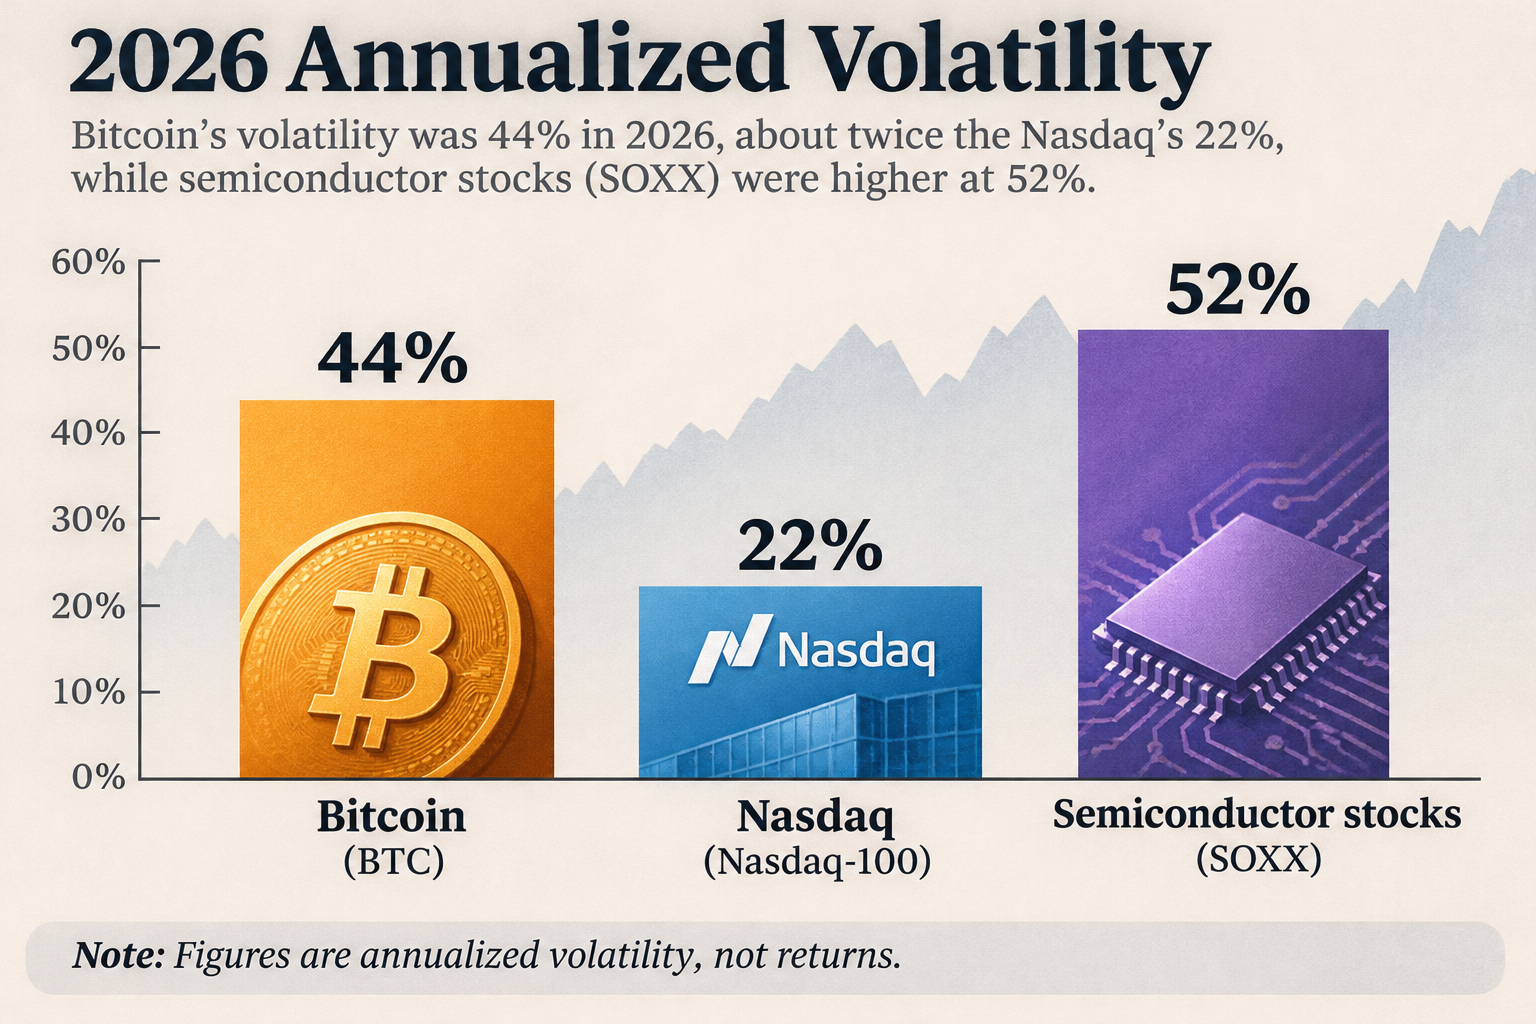
Bitcoin’s annualized volatility fell from 90% in 2017 to 44% in 2026, according to the analysis. That was still twice the Nasdaq’s 22%. Semiconductor stocks, represented by SOXX, registered 52% in 2026—the first year in the ten-year comparison in which their volatility exceeded Bitcoin’s. DWF Labs cautioned that 2017 was unusually calm for stocks, making it a low starting point for comparisons of their subsequent volatility.
A different relationship within technology stocks
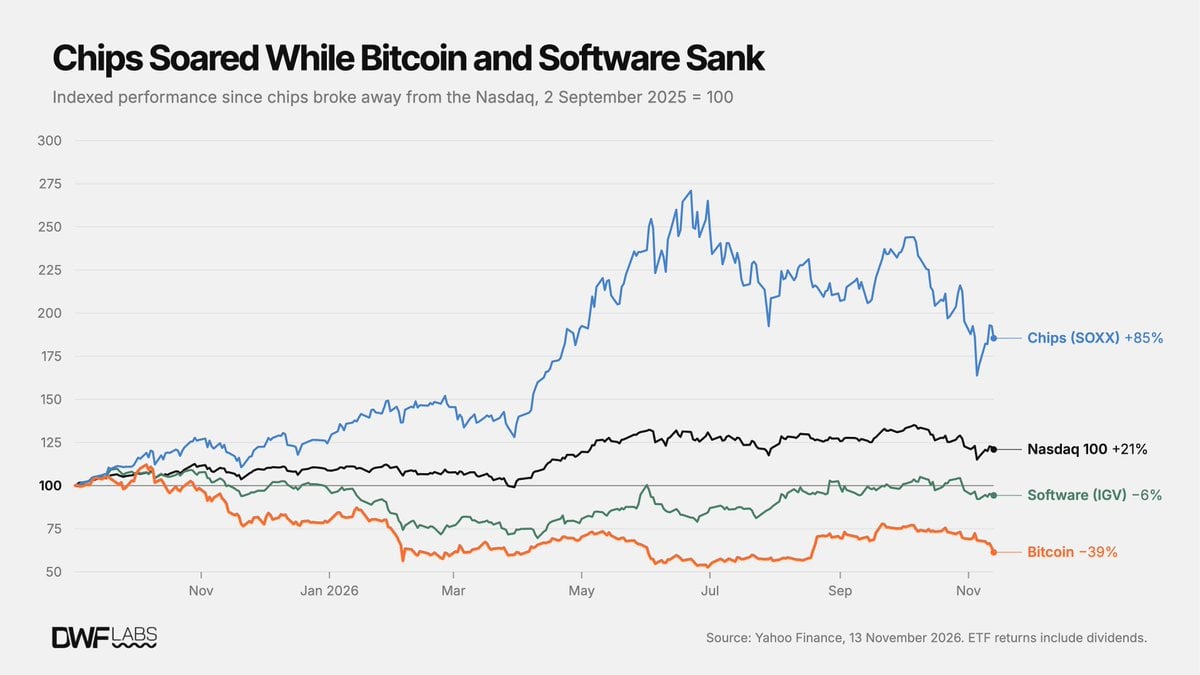
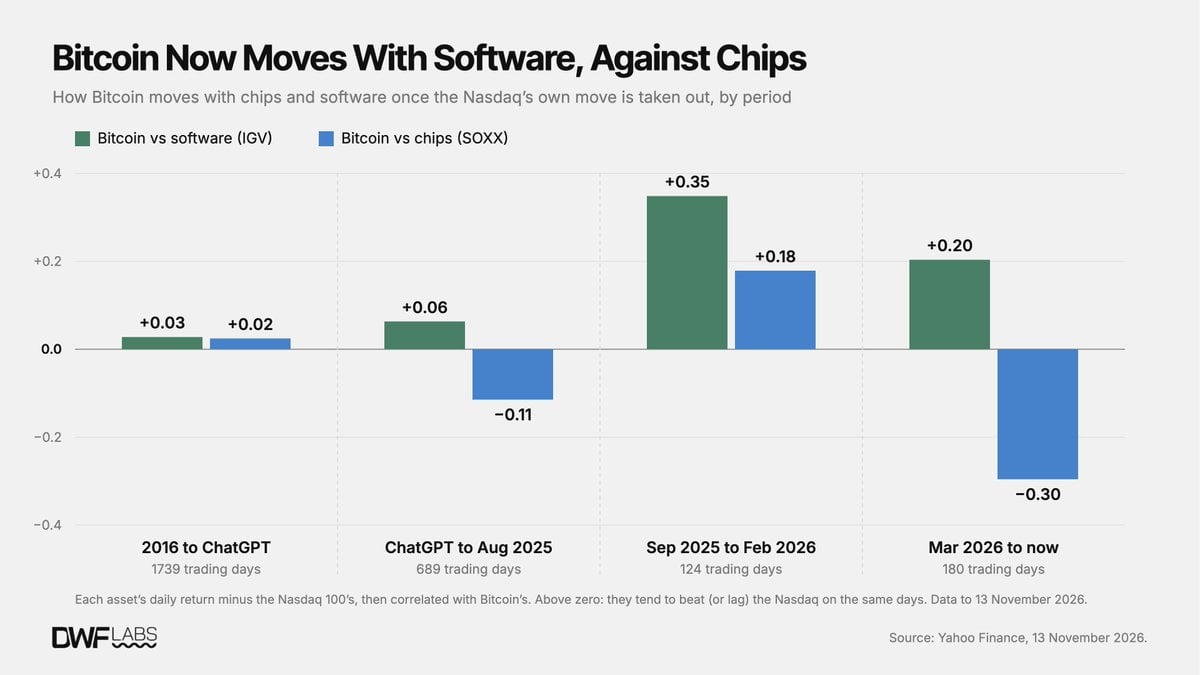
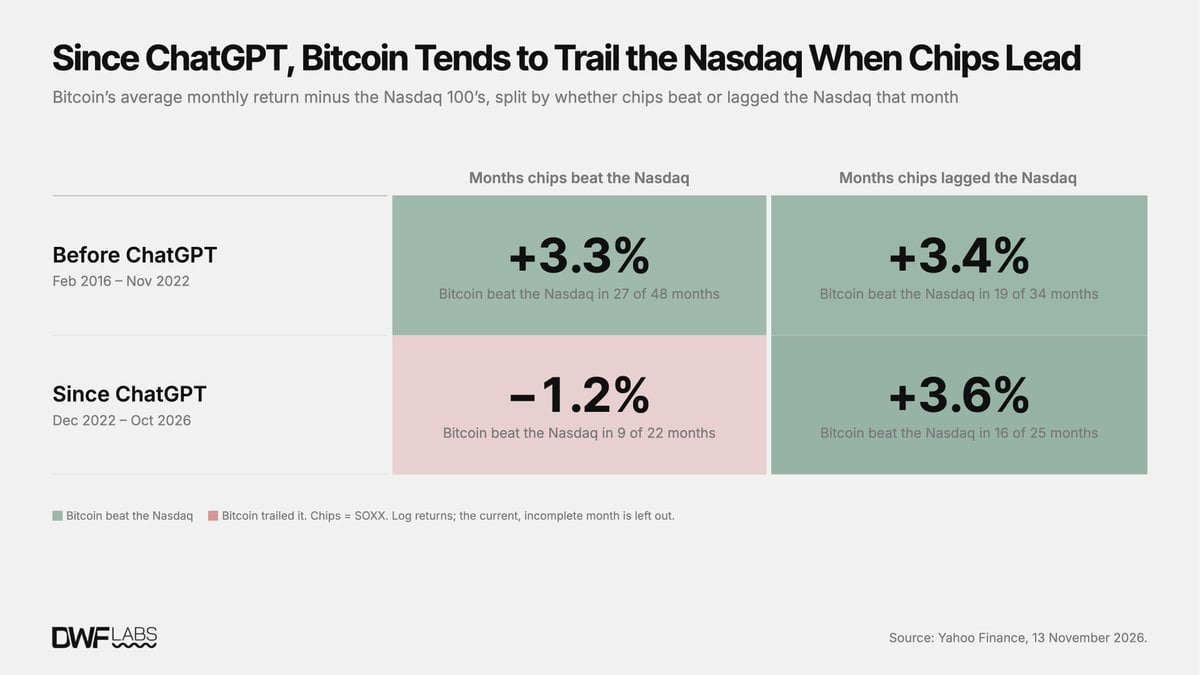
DWF Labs also compared each asset’s return relative to the Nasdaq, subtracting the Nasdaq’s return to look beyond their shared market movement. On that measure, Bitcoin’s correlation with software stocks was 0.20 from March 2026 onward, versus −0.30 with semiconductor stocks. Since September 2025, the analysis reported gains of 85% for semiconductors and 21% for the Nasdaq, alongside declines of 6% for software and 39% for Bitcoin.
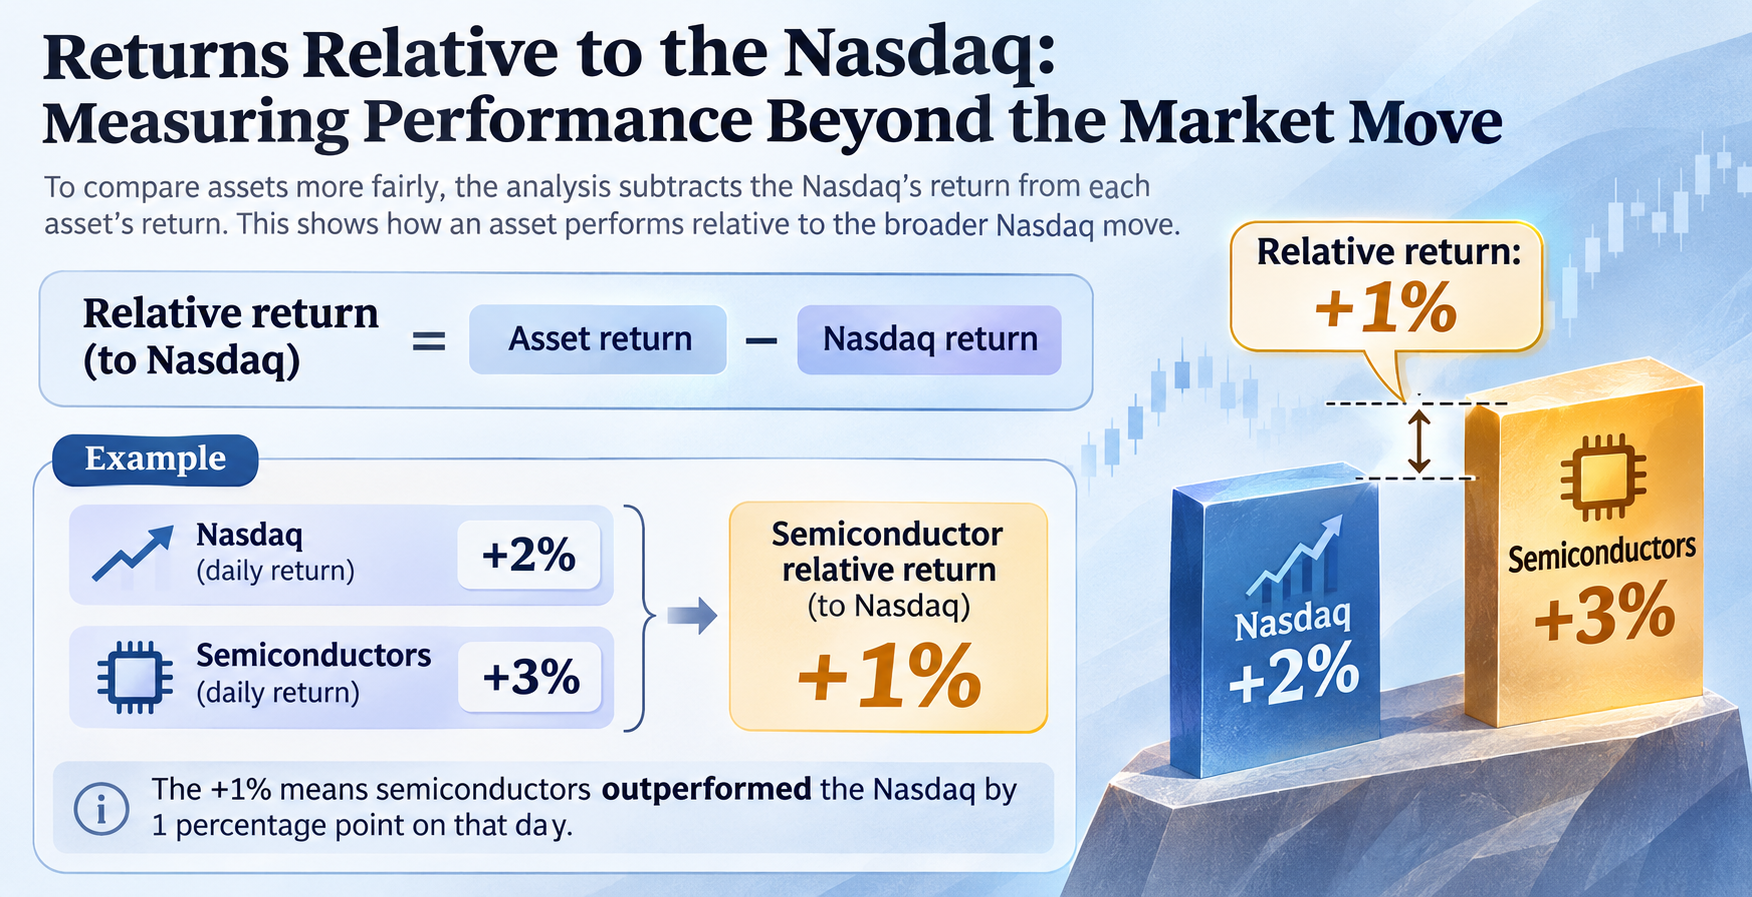
These relative-return figures describe a divergence within the period studied, not an independent Bitcoin valuation signal. Taken together, DWF Labs’ data portray an asset whose historical behavior has been closer to a risk asset than a dependable haven, even as its volatility has declined and its recent correlation with gold has risen. Neither trend, on its own, establishes a forecast.