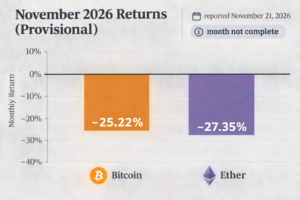
As reported on November 21, 2026, several widely watched Bitcoin measures were flashing stress. They describe different things—a price relative to a model curve, an indicator reading, and a drawdown from a peak. None establishes where the price will go next.
A power-law support line under scrutiny
Fidelity global macro strategist Jurrien Timmer said he remained bullish based on Bitcoin’s four-year cycle and a power-law model. He said the price had returned to his model’s support curve, which he placed at about $62,000 and rising. Timmer also set a condition that could challenge his view: a move far below that line would call his broader analytical framework into question.
That support curve is a model reference, not a price floor. Timmer’s statement identifies a way his framework could be tested; it does not demonstrate that the curve will hold.
An indicator reading and a historical drawdown
CoinGlass put the Ahr999 indicator at about 0.258, near its reported 0.24 reading during the March 2020 crash. The source describes readings below 0.3 as rare historically, but does not provide the indicator’s calculation or evidence that such readings reliably identify a bottom.
Separately, analyst Darkfost said Bitcoin’s decline to roughly $55,100 amounted to a 56.3% drawdown from its all-time high. Darkfost compared that with drawdowns of 75.5% in the 2022–2023 bear market and 93% in 2012, and argued that maximum bear-market drawdowns have diminished as Bitcoin’s market capitalization has grown. Those comparisons describe past declines; they cannot determine the depth of this one.
The three measures should not be treated as interchangeable: a model boundary, an indicator reading and a peak-to-current-price decline answer different questions. Their historical behavior offers context, not a guaranteed turning point.