
As reported on November 10, 2026, three figures framed the Bitcoin market picture: a sharp price swing accompanied by leveraged-position liquidations, a week of spot ETF outflows, and another Strategy purchase. They describe different things—and none is a price forecast.
Price and leveraged positions
Bitcoin briefly fell to $73,500, rebounded above $75,400, then declined again. Citing Coinglass data, Bitcoin.com News reported more than $1.2 billion in crypto-market liquidations, including $1.04 billion in long positions. Bitcoin leveraged-position liquidations exceeded $324 million, of which more than $281 million were longs.
Liquidation totals show the scale of positions closed during the move. They do not, by themselves, establish where Bitcoin’s price will go next.

Spot ETF flows
SoSoValue data showed $1.282 billion in net outflows from U.S. spot Bitcoin ETFs across the November 2–6 trading week, measured in Eastern Time. BlackRock’s IBIT had the largest weekly net outflow at $1.209 billion, while Grayscale’s GBTC recorded $61.0081 million in net outflows. Fidelity’s FBTC had the largest weekly net inflow at $93.117 million.
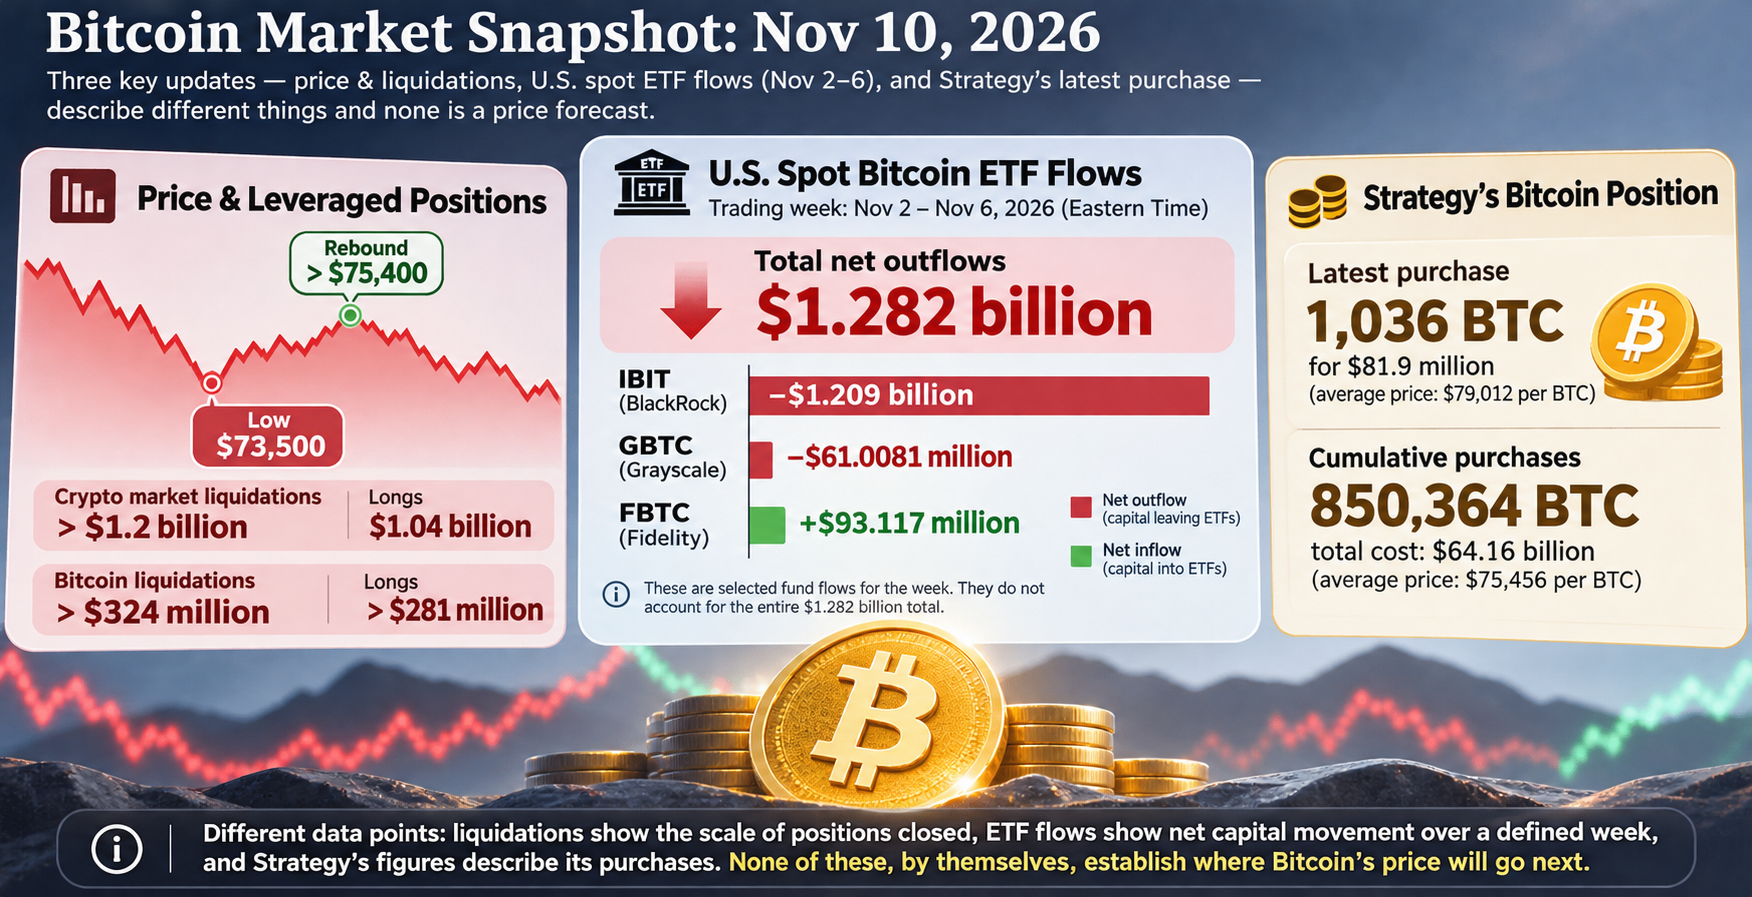
These are flows over a defined trading week, not a live reading of Bitcoin demand or a model-derived price target.

Strategy’s Bitcoin position
Bitcoin News said on X that Strategy bought 1,036 BTC for $81.9 million at an average price of $79,012 per coin. It reported cumulative purchases of 850,364 BTC at a total cost of $64.16 billion, or an average of $75,456 per coin. The reported purchase price and cumulative cost basis describe Strategy’s transactions; neither is a valuation floor for Bitcoin.