
Historical report: Published November 17, 2026, at 09:27 (UTC+8). The figures below describe the market period covered by the original report, not current conditions.
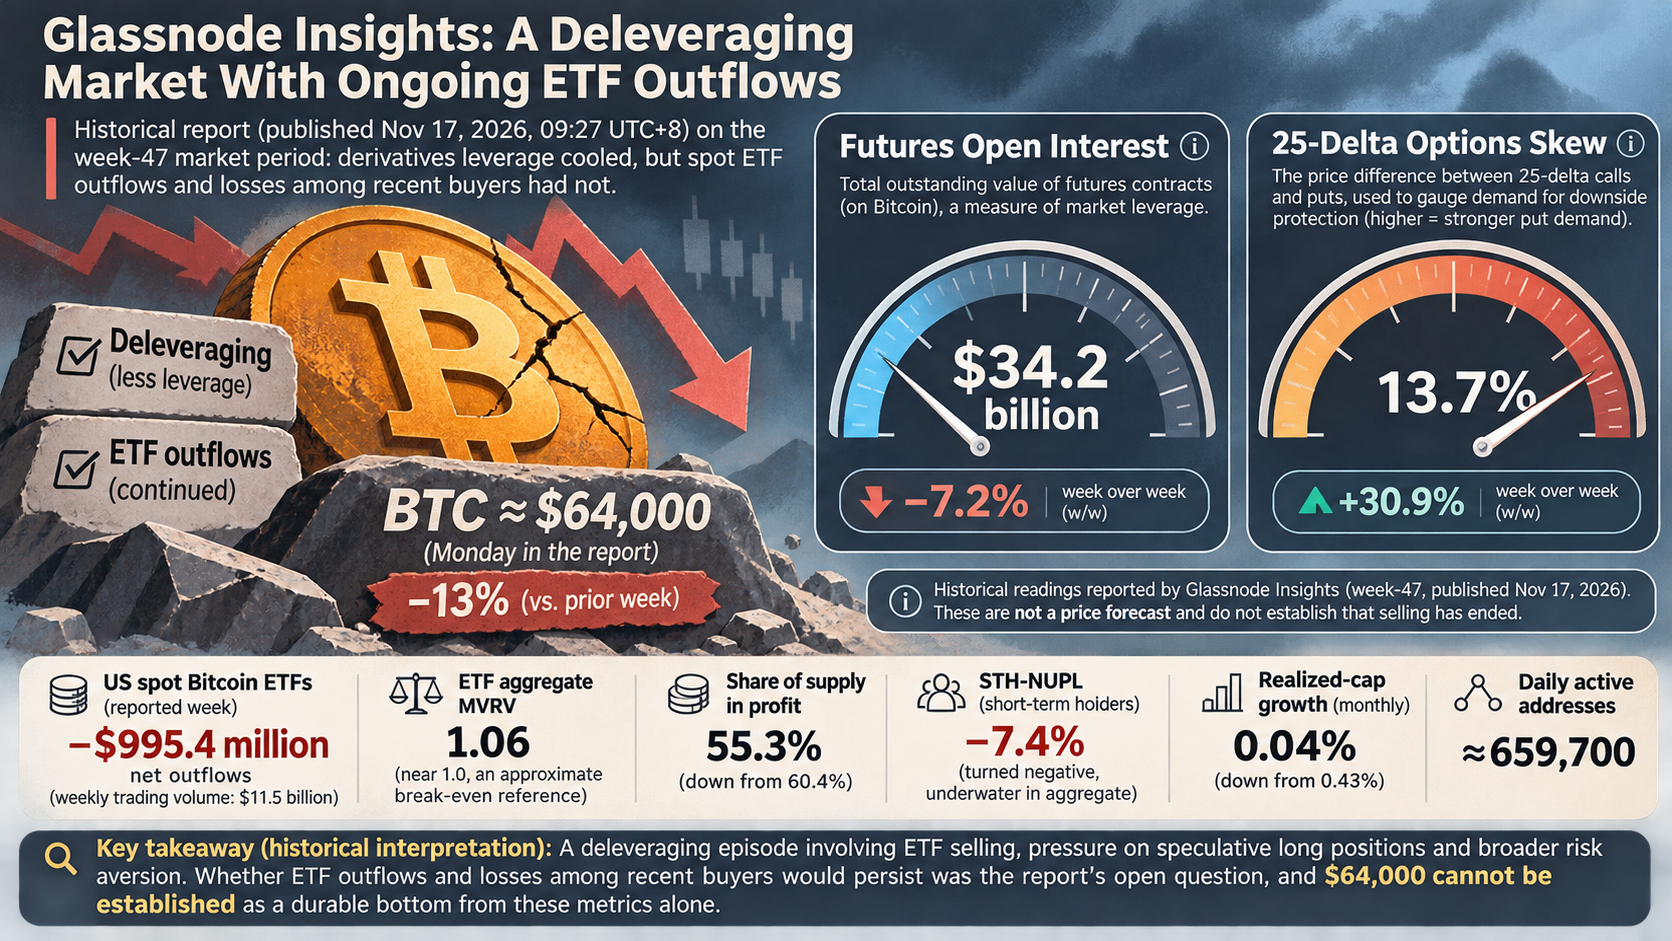
Bitcoin was trading near $64,000 on the Monday covered by the report, after falling about 13% over the preceding week. It had briefly dropped below $63,000 on Saturday, its lowest level since late August. The key distinction in Glassnode Insights’ week-47 analysis is that derivatives leverage had cooled, while spot ETF outflows and losses among recent buyers had not.
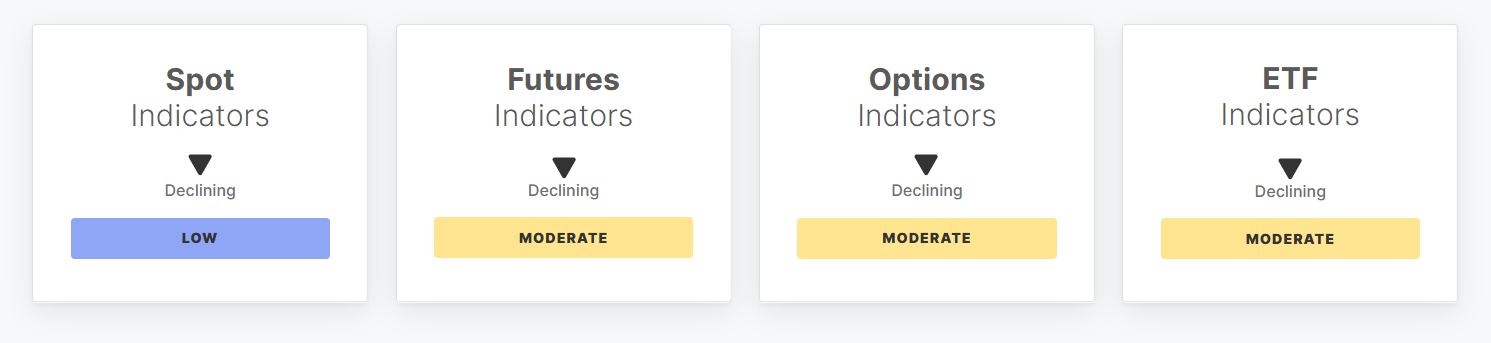
What the market measures show
Futures open interest fell 7.2% week over week to $34.2 billion. Perpetual-futures funding rates also retreated from elevated levels into the report’s neutral range. Those measures point to less outstanding leverage; they do not establish that selling has ended. Spot cumulative volume delta, a measure of aggressive buying minus aggressive selling, deteriorated from −$51.5 million to −$133.7 million. Perpetual-futures CVD moved from −$493 million to −$1.4 billion. Meanwhile, 25-delta options skew rose 30.9% to 13.7%, which the report associated with stronger demand for downside protection.
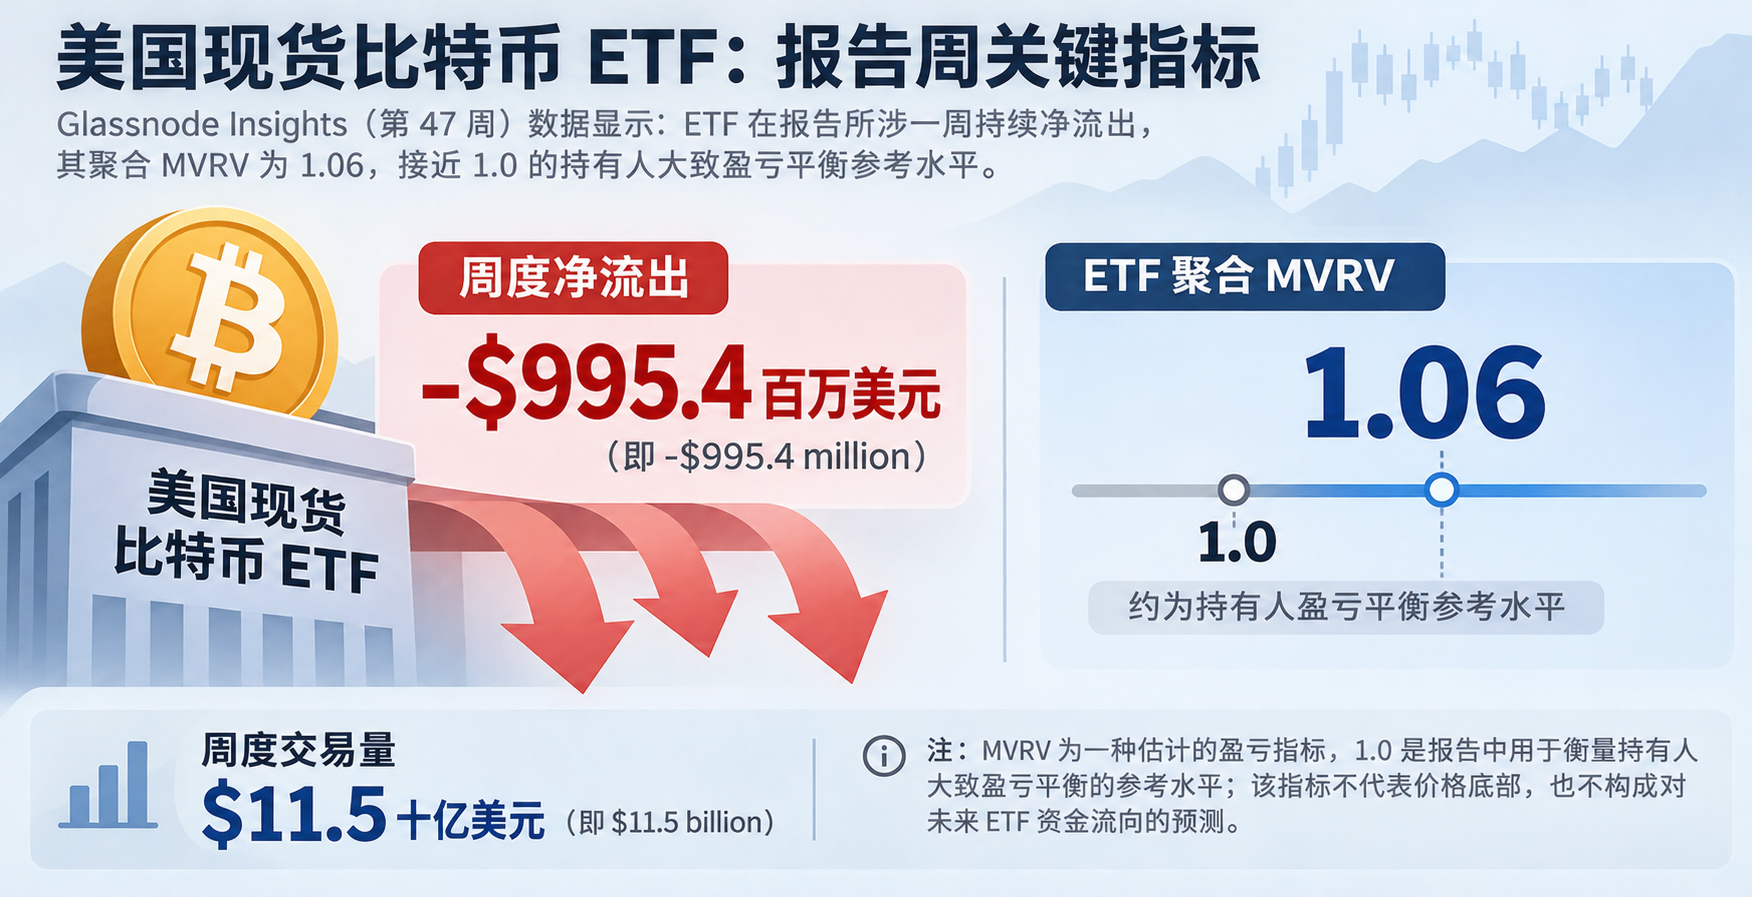
US spot Bitcoin ETFs recorded net outflows on every trading day of the reported week. Weekly net outflows totaled $995.4 million, while weekly trading volume was $11.5 billion. The report put the ETFs’ aggregate MVRV at 1.06, near the 1.0 level it uses as an approximate break-even reference for holders. That ratio describes an estimated profit-and-loss position; it is not a price floor or a forecast of future ETF flows.
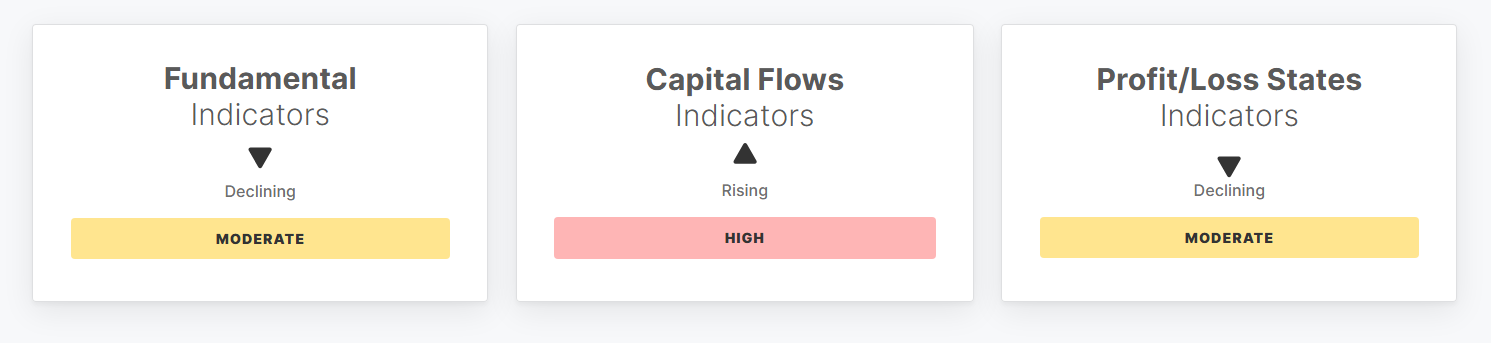
On-chain activity versus holder losses
Activity remained substantial even as the profit picture weakened. Entity-adjusted daily transfer volume rose 3.6% to $5.4 billion, and daily active addresses stood at about 659,700. Neither measure, by itself, shows that new capital is entering the market: the report’s monthly realized-cap growth measure slowed from 0.43% to 0.04%.
The share of Bitcoin supply in profit fell from 60.4% to 55.3%. Short-term holders’ net unrealized profit/loss ratio, or STH-NUPL, turned negative at −7.4%, indicating that this group was underwater in aggregate under the measure’s assumptions. The short-term-to-long-term holder supply ratio edged up to 15.1%, while the report’s “hot capital” share remained at 22.0%.
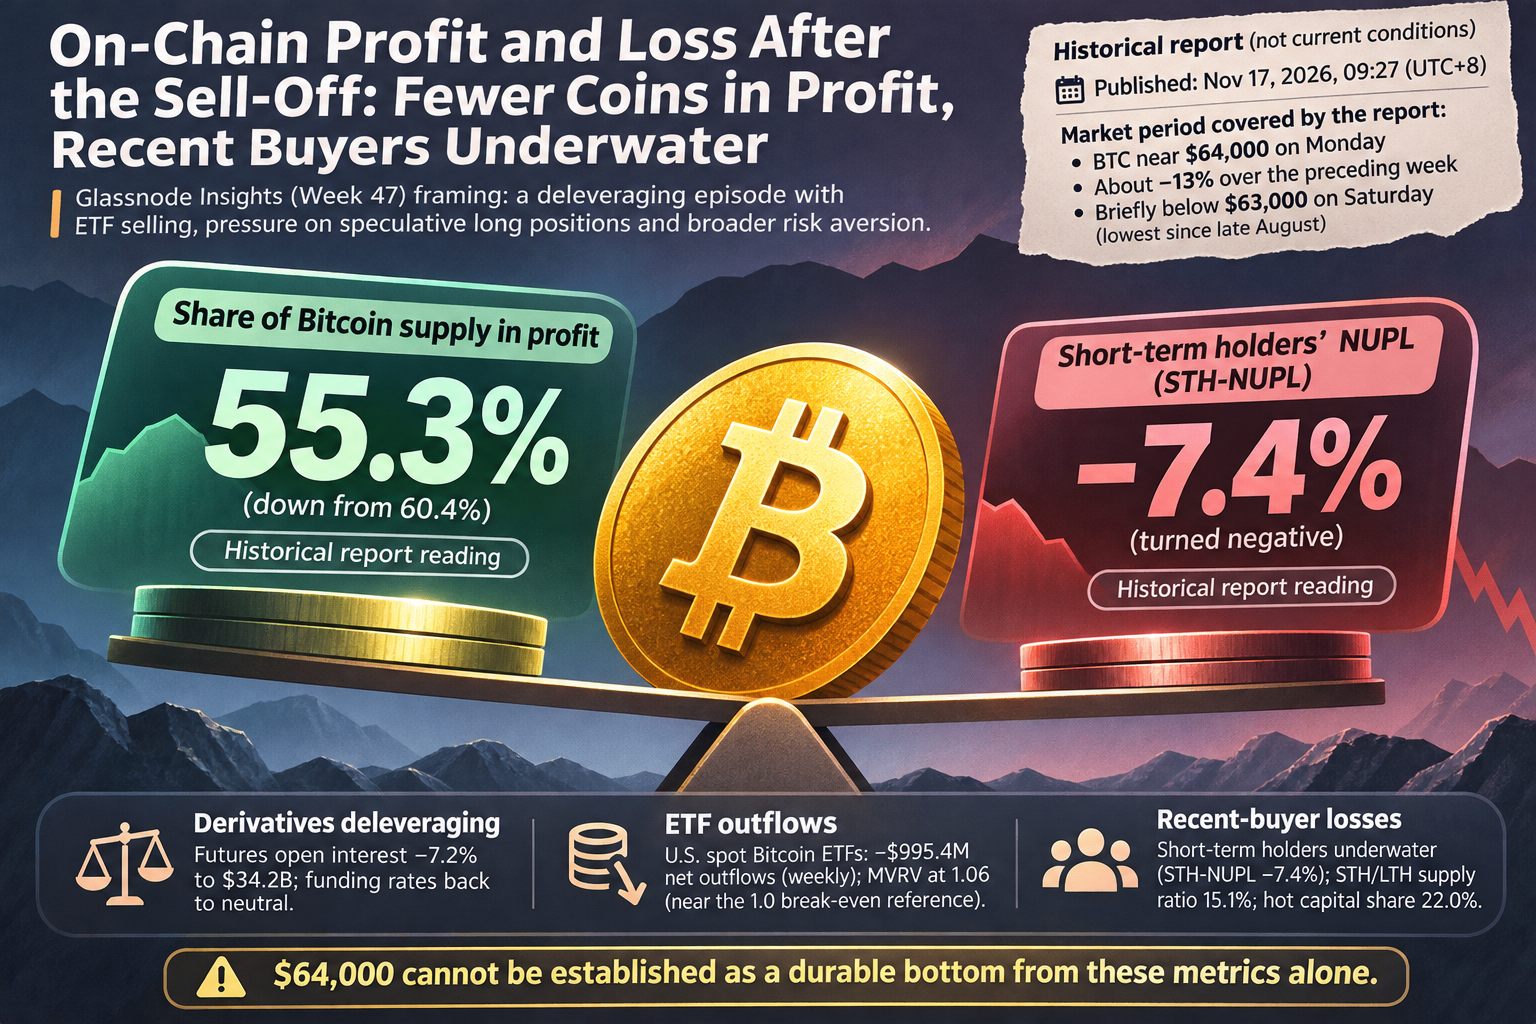
Glassnode Insights framed the decline as a deleveraging episode involving ETF selling, pressure on speculative long positions and broader risk aversion. That is the report’s interpretation, not proof that any one factor caused the price move. Its open question was whether ETF outflows and losses among recent buyers would persist. The reported readings help describe the sell-off, but $64,000 cannot be established as a durable bottom from these metrics alone.
Source: techflowpost.com (originally published 2026-11-17 09:27 UTC+8)