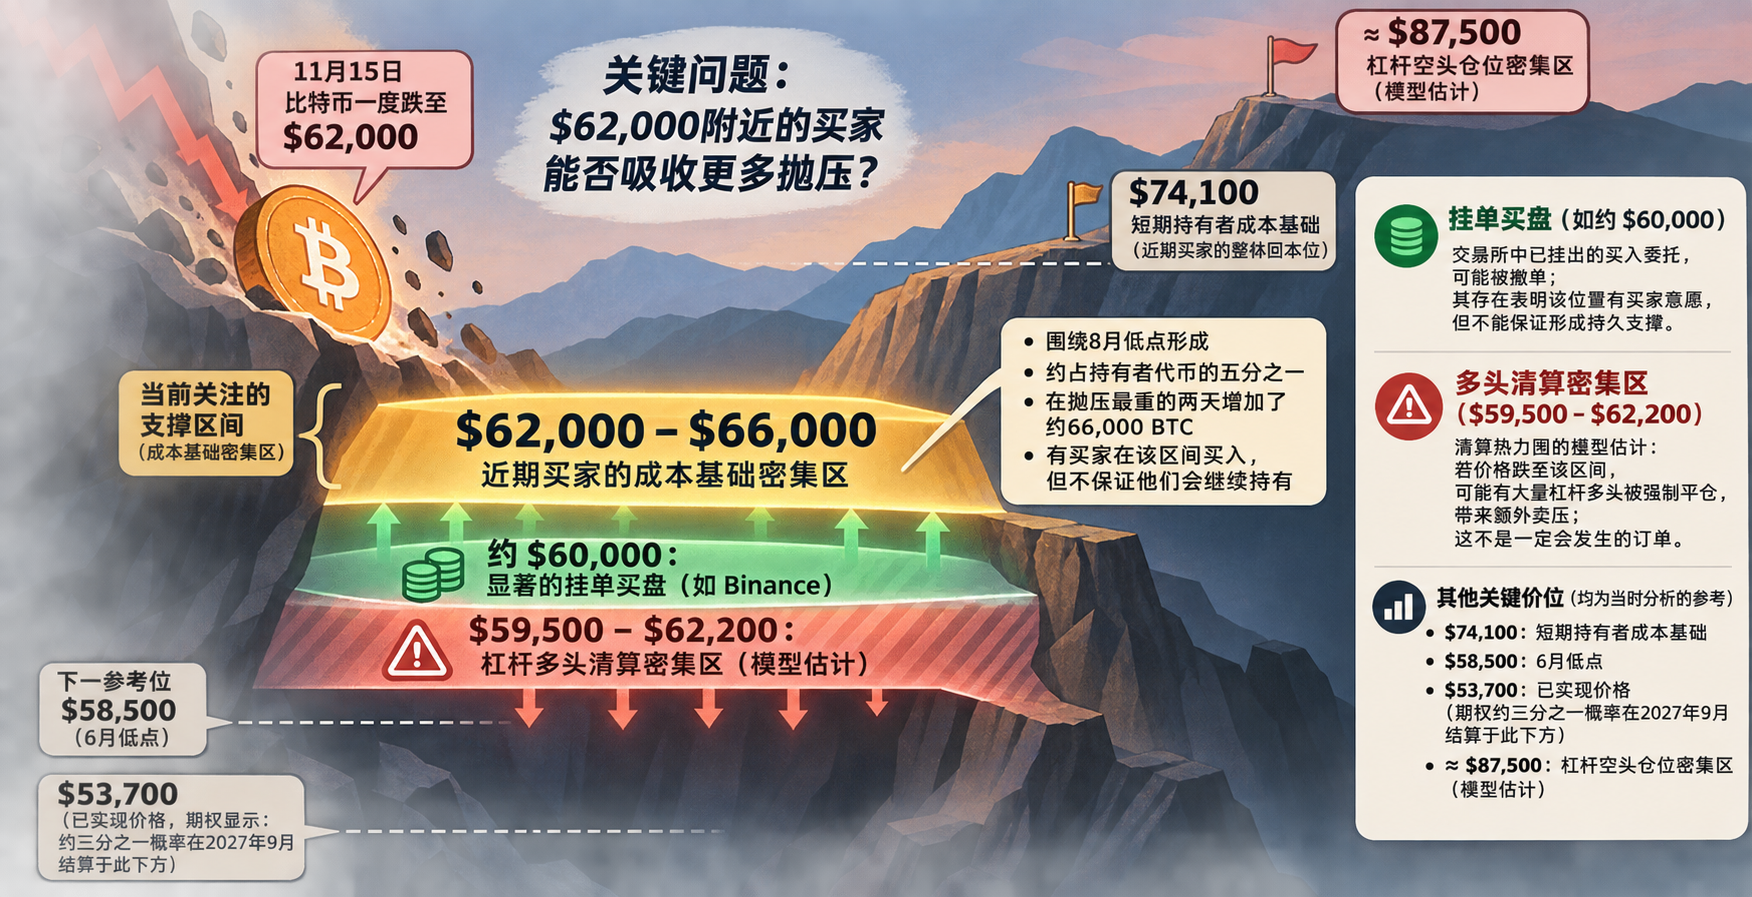
Glassnode’s analysis, reported on November 18, 2026, describes a sharp Bitcoin sell-off that reached $62,000 on November 15. Its central question is whether buyers around that level can absorb further selling. The figures below describe conditions at the time of that report, not a live market reading.
What the loss data measures
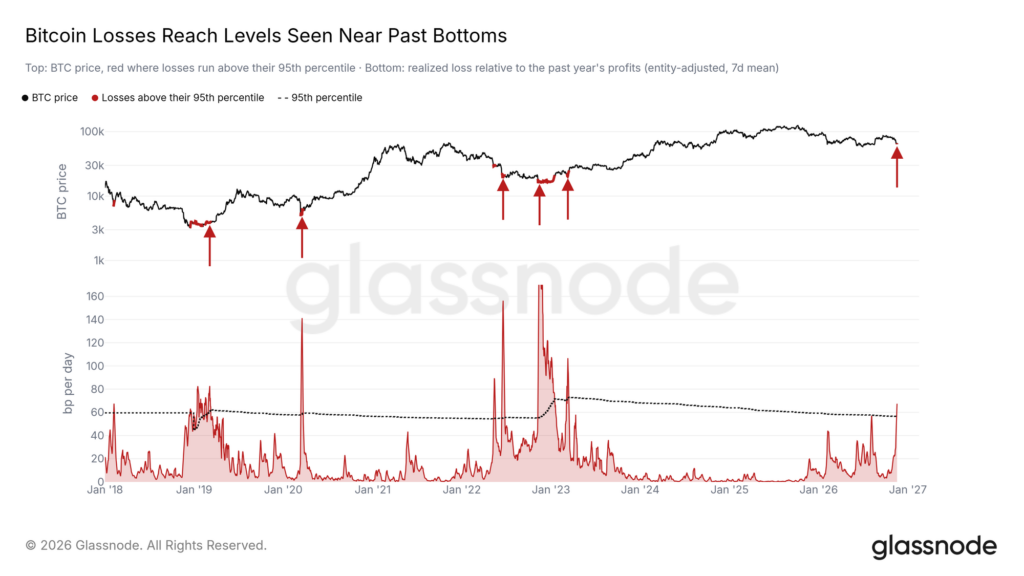
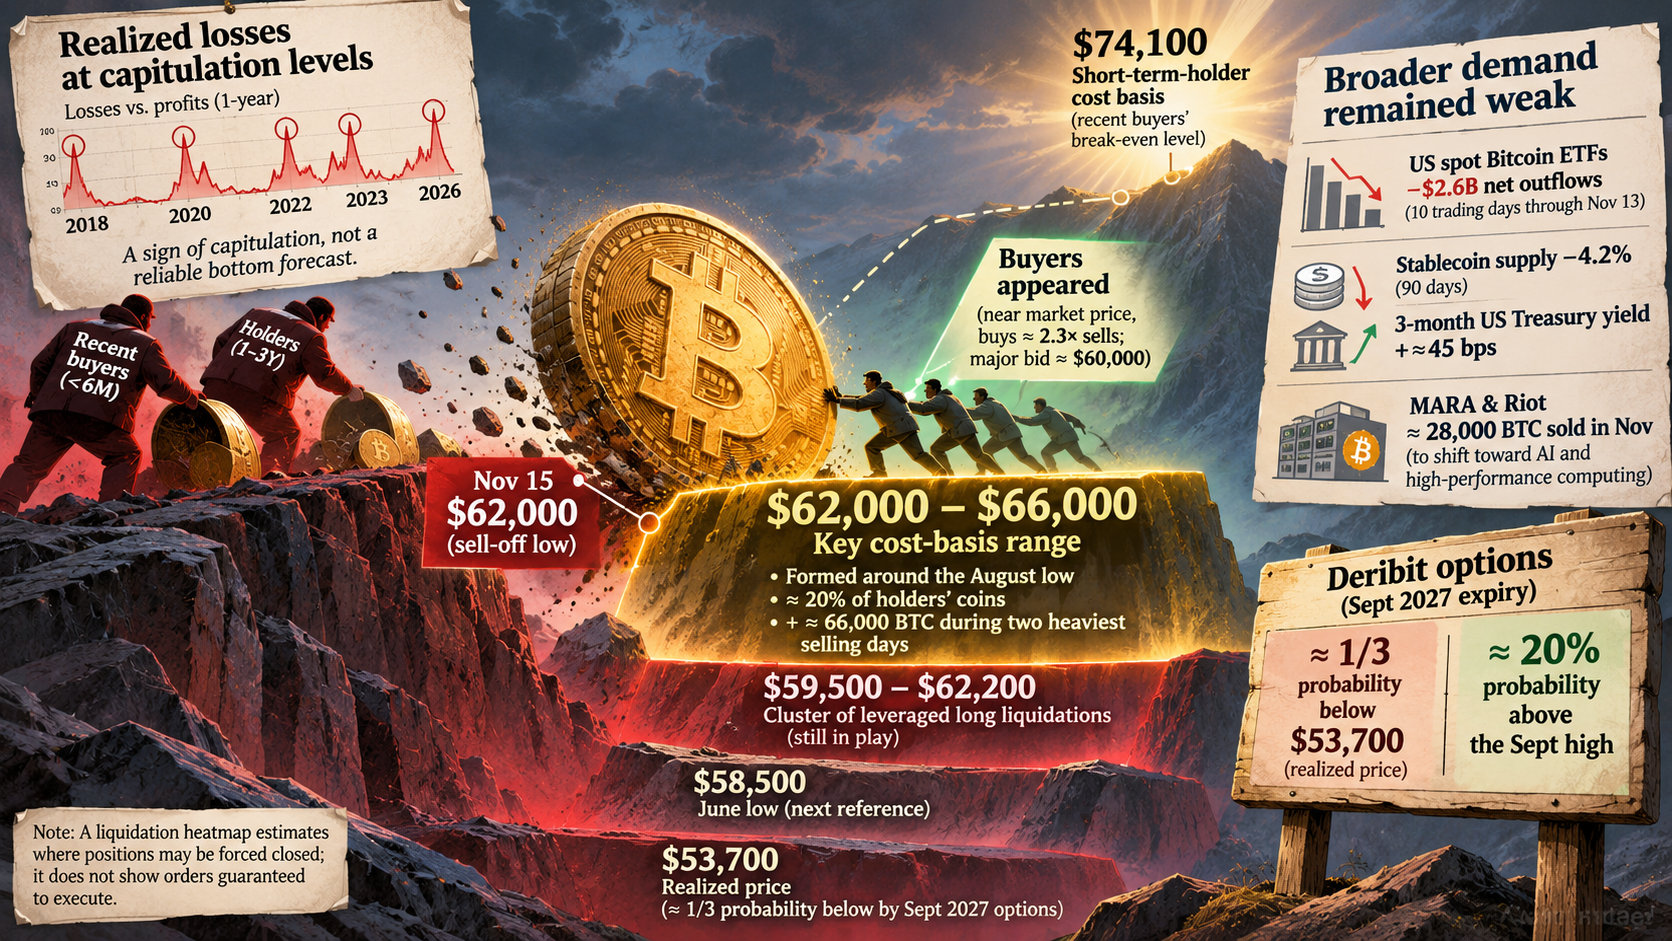
Glassnode compared realized losses—losses locked in when coins change hands below their purchase price—with realized profits over the preceding year. The resulting measure reached levels it said had previously appeared near market bottoms in 2018, 2020, 2022 and early 2023. That historical association is a sign of capitulation, not a reliable bottom forecast.
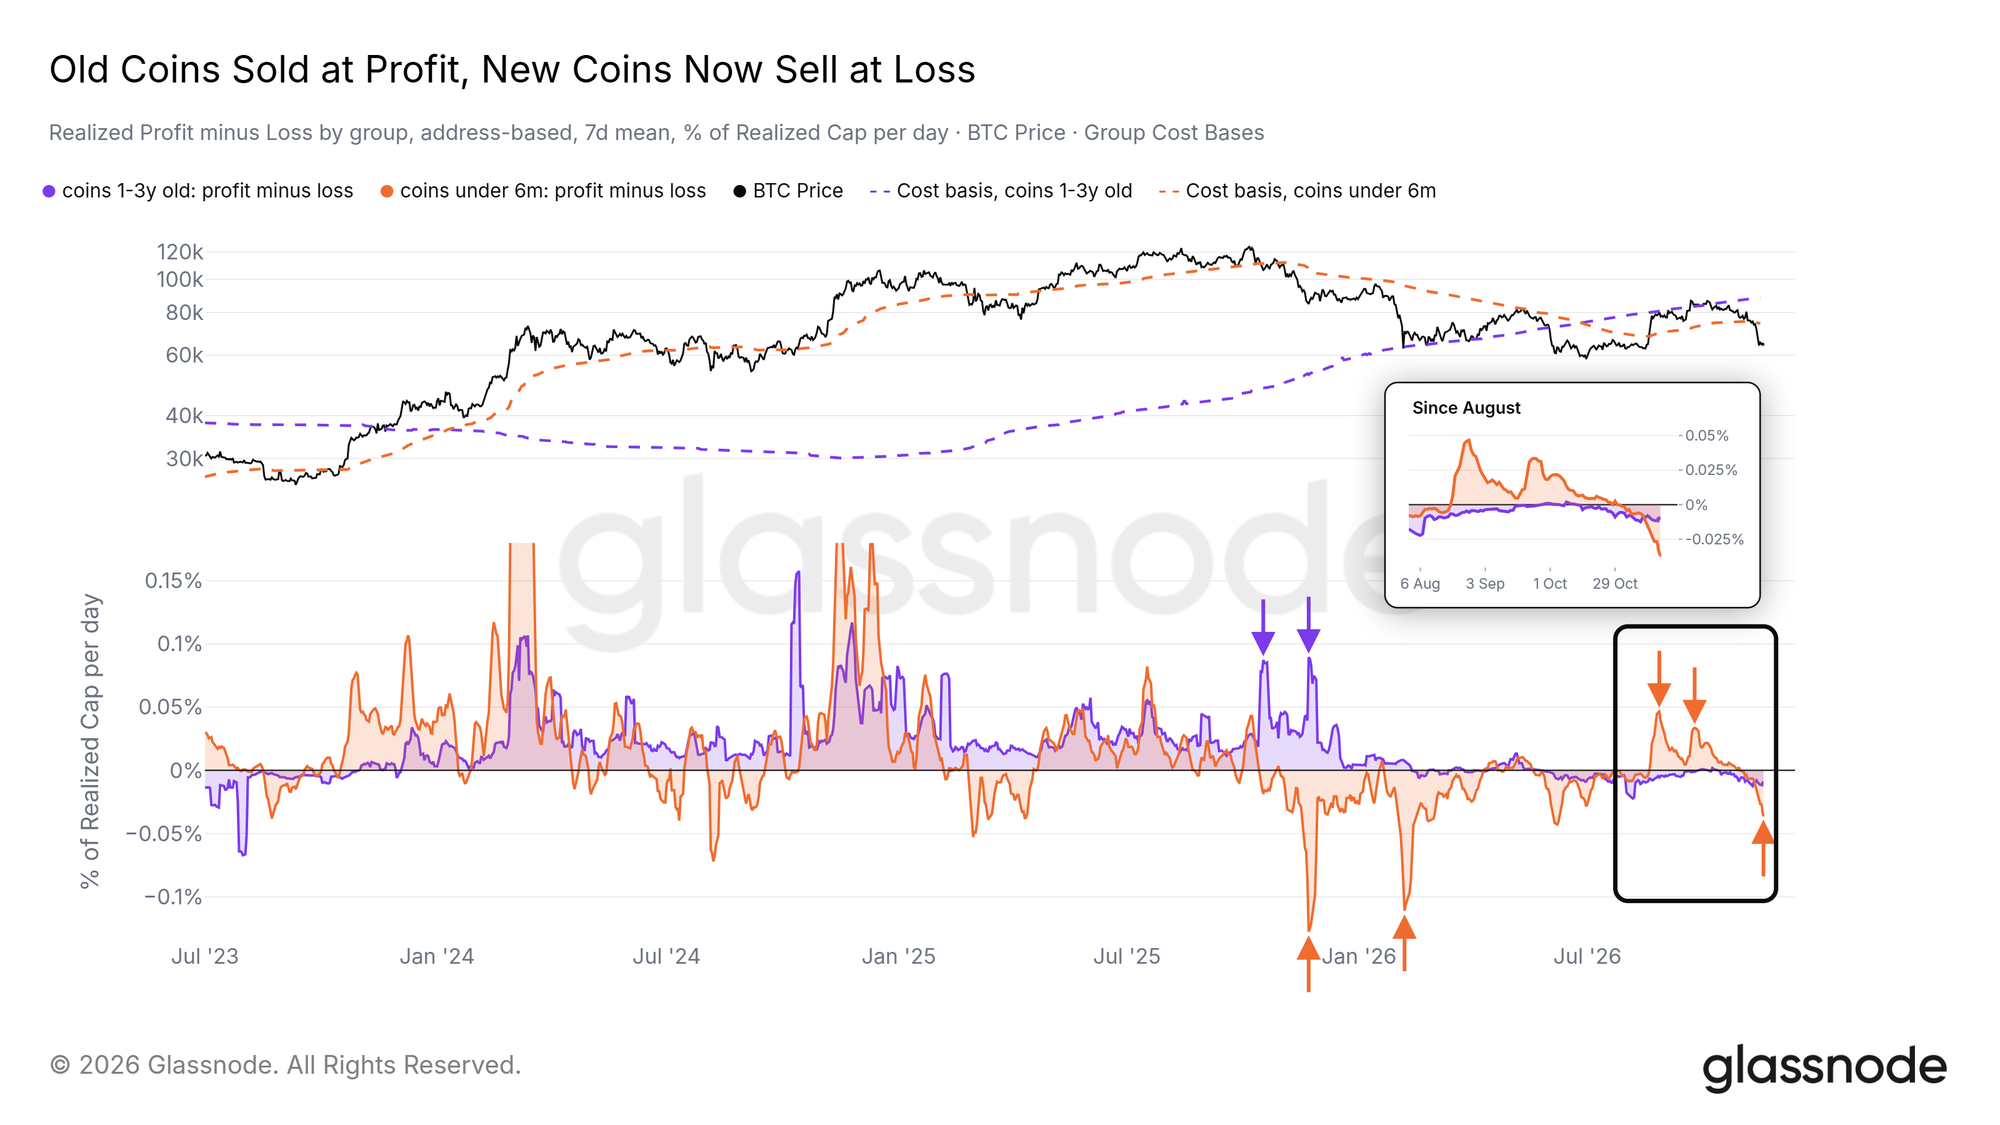
The selling was concentrated among more recent buyers. According to Glassnode, coins held for one to three years last recorded substantial profit-taking in late 2025. Coins held for less than six months saw large realized losses in early 2026, profit-taking during the September–October rebound, and renewed loss-taking in the November decline. Bitcoin was below both groups’ average purchase costs at the time of the report, leaving further loss-driven selling possible.
Why the $62,000–$66,000 range matters
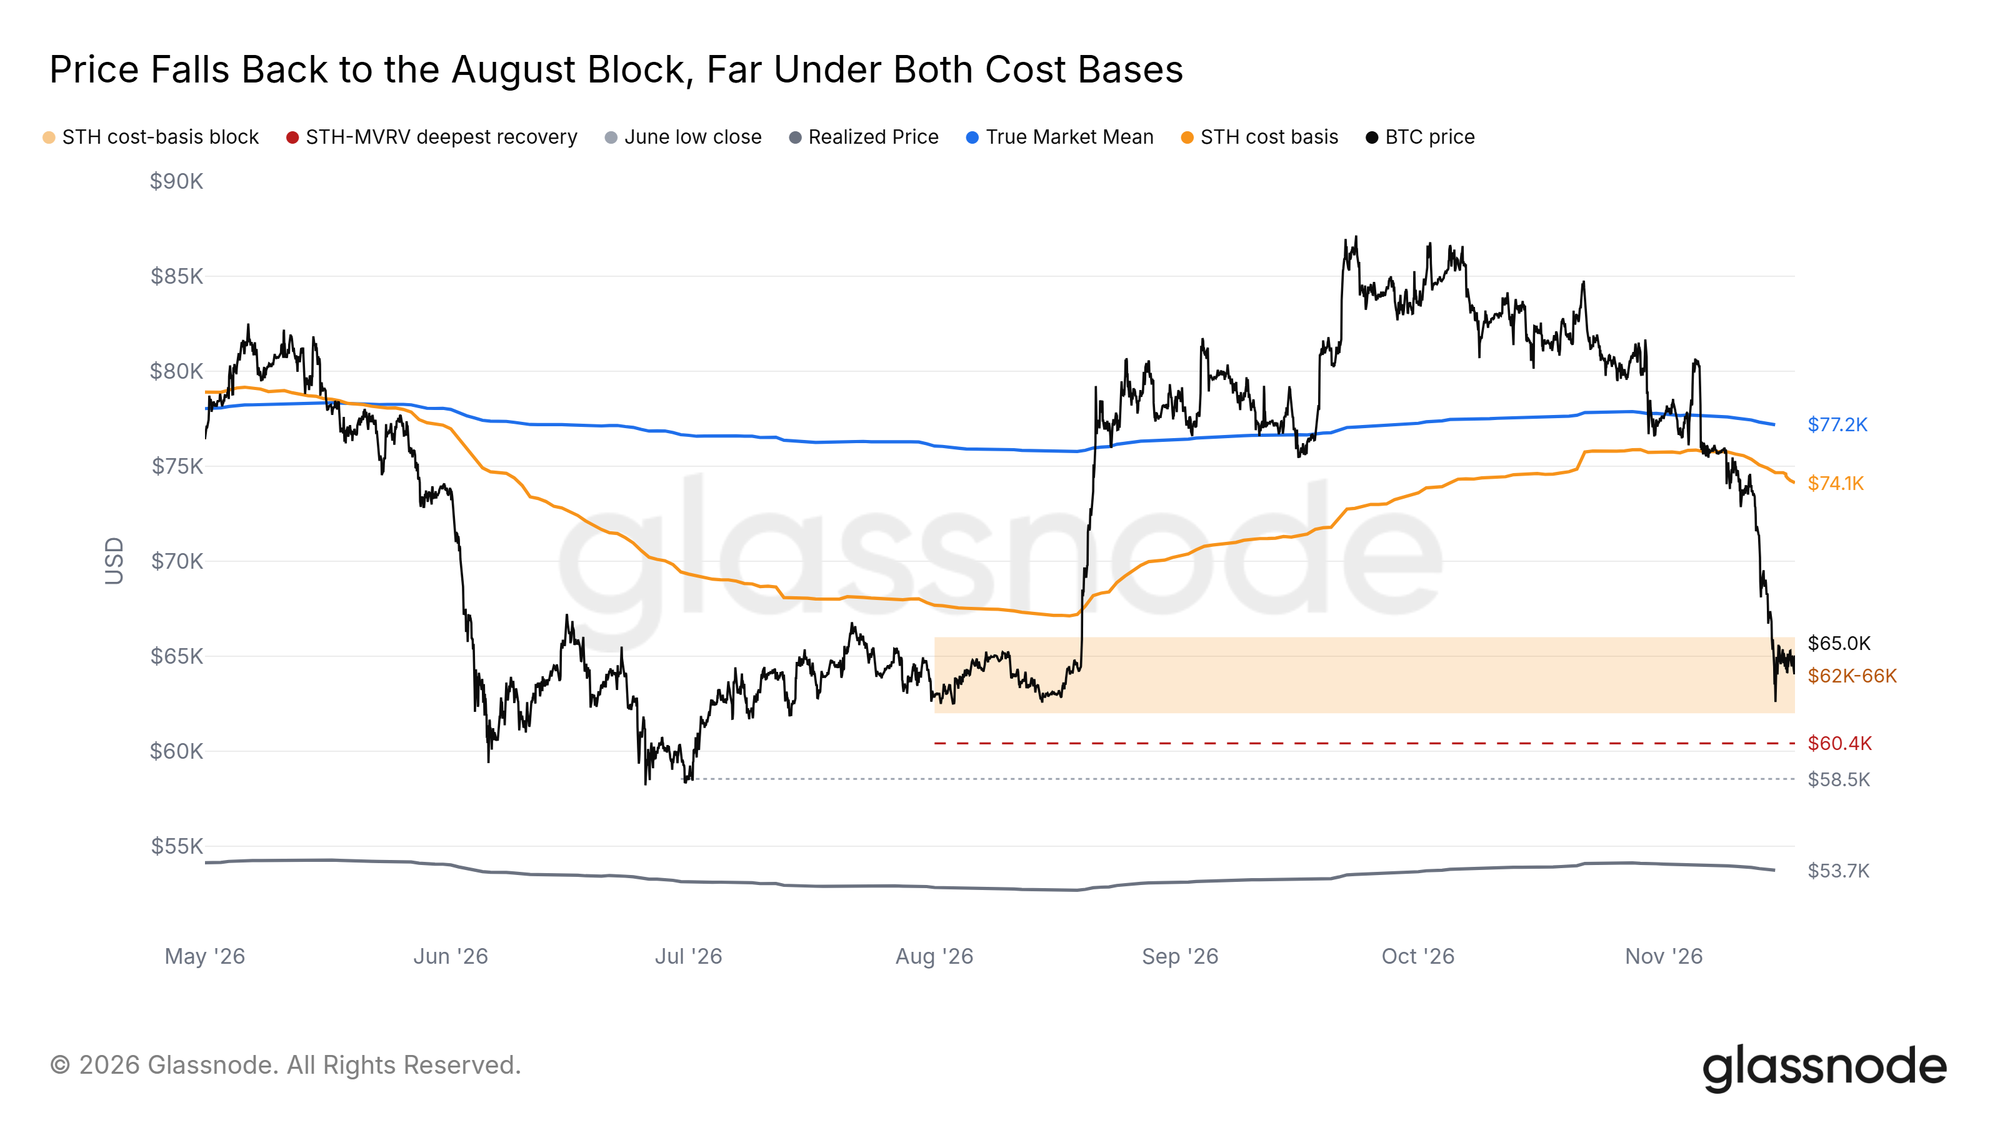
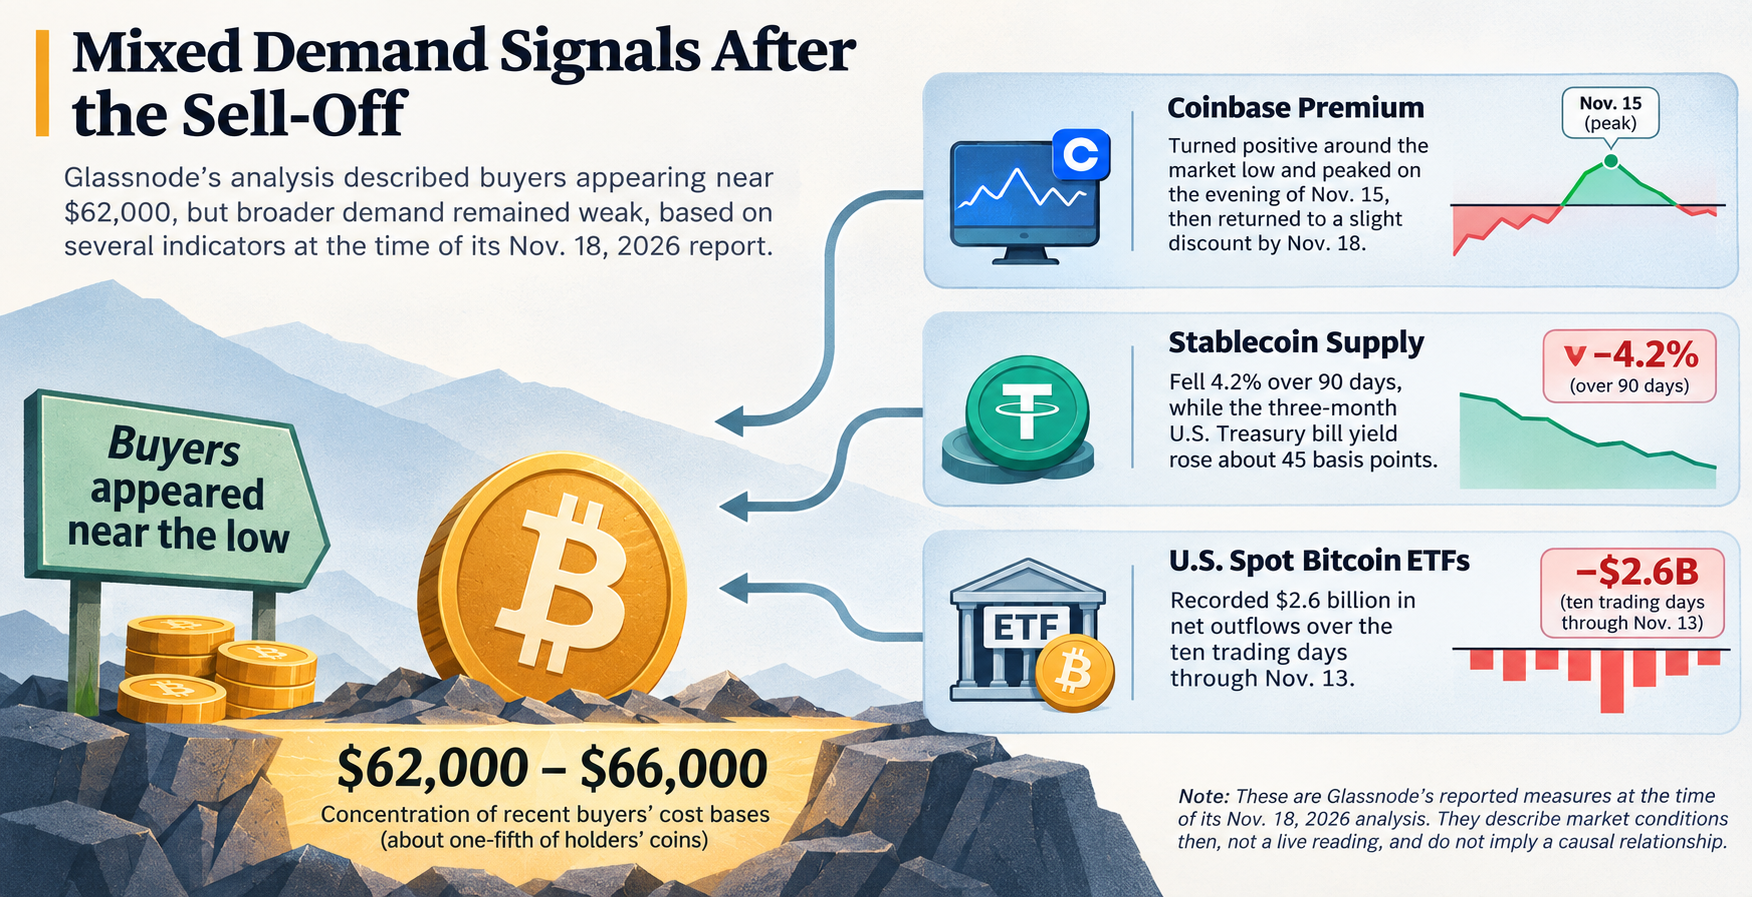
Glassnode identified $62,000–$66,000 as the main concentration of recent buyers’ cost bases beneath the prior price. Formed around the August low, the range contained roughly one-fifth of holders’ coins in its analysis and gained about 66,000 BTC during the two heaviest days of selling. That suggests buying occurred there; it does not establish that those buyers will hold.
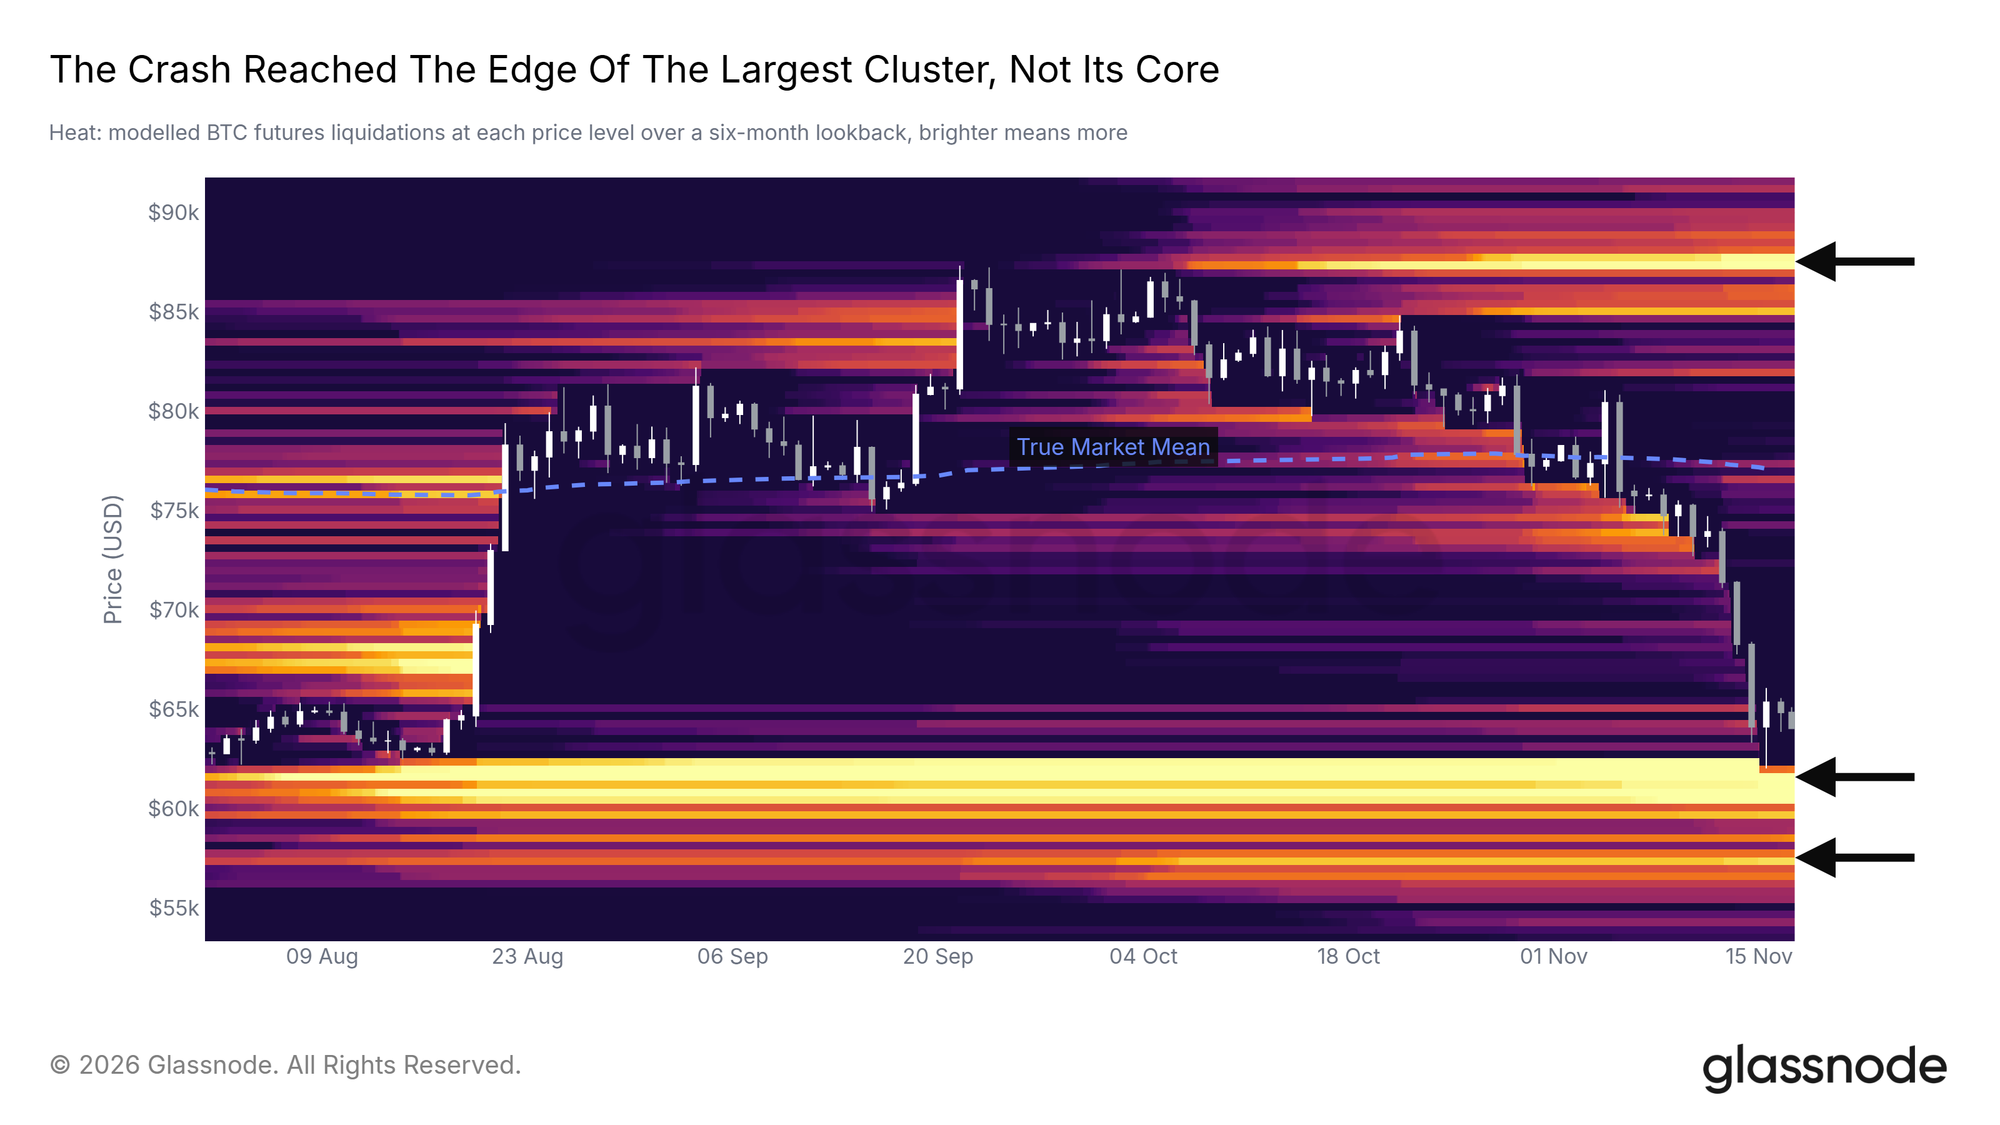
Few short-term holders had bought below $62,000, while Glassnode’s liquidation map placed a large cluster of leveraged long positions at $59,500–$62,200. It warned that a daily close below the range could put the August buyers underwater and trigger further long liquidations. The June low of $58,500 was its next lower reference point. Above the market, $74,100 was the short-term-holder cost basis—a potential break-even level for that cohort, not a confirmed recovery target.
The leverage picture had already changed. Measured against open interest, Glassnode said November 13 and 14 saw some of the largest batches of long liquidations since 2023. Its modeled liquidation heatmap suggested most long positions vulnerable above $62,000 had been cleared, though exposure remained in the $59,500–$62,200 cluster. A larger cluster of short positions sat much higher, near $87,500. A liquidation heatmap estimates where positions may be forced closed; it does not show orders guaranteed to execute.
Buyers appeared, but broader demand remained weak
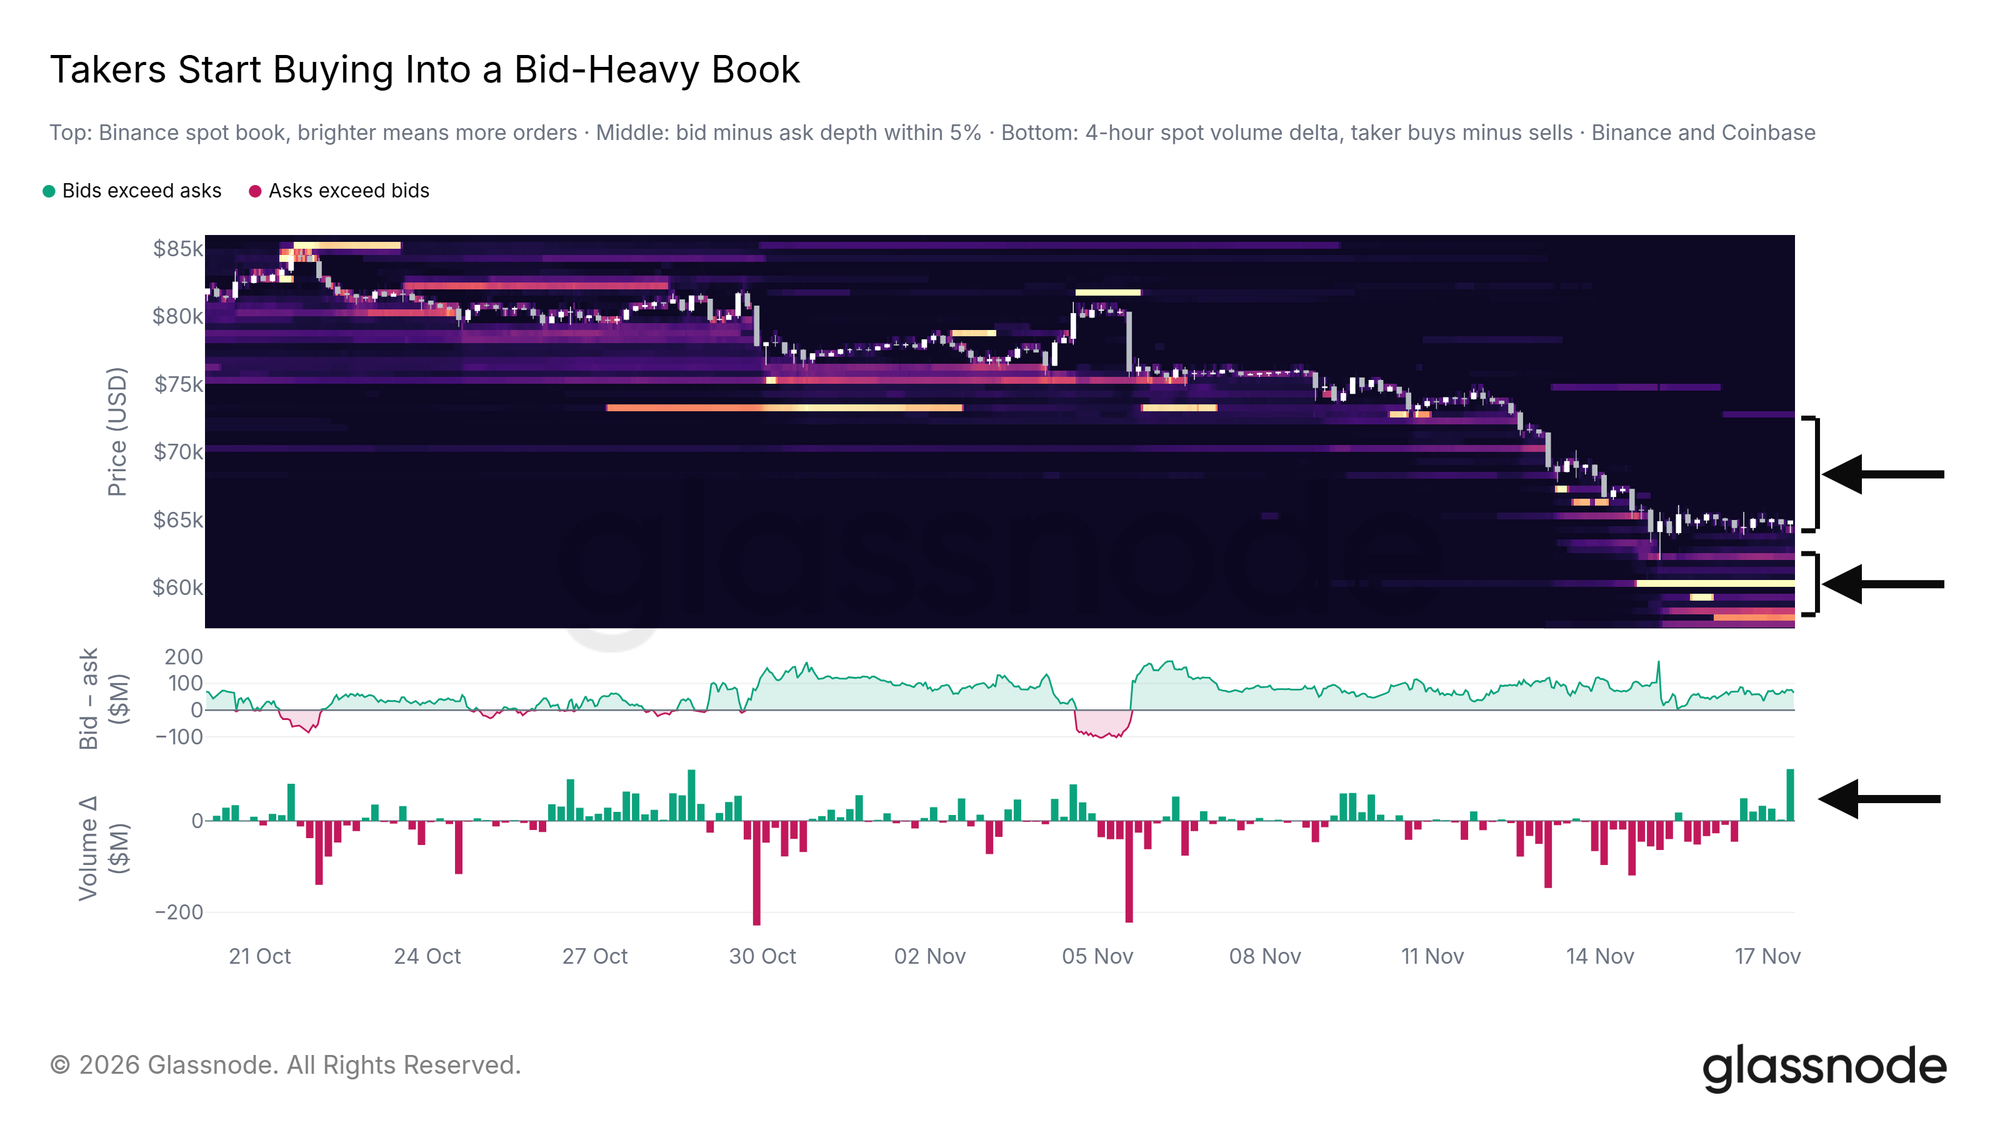
Within 5% of the market price, posted buy orders on Binance and Coinbase totaled about 2.3 times posted sell orders, Glassnode reported. A prominent Binance bid level sat near $60,000. Aggressive sellers had traded into those bids during the decline, before order flow turned to net buying over the preceding day. Posted bids can be withdrawn, so their presence alone is not proof of durable support.
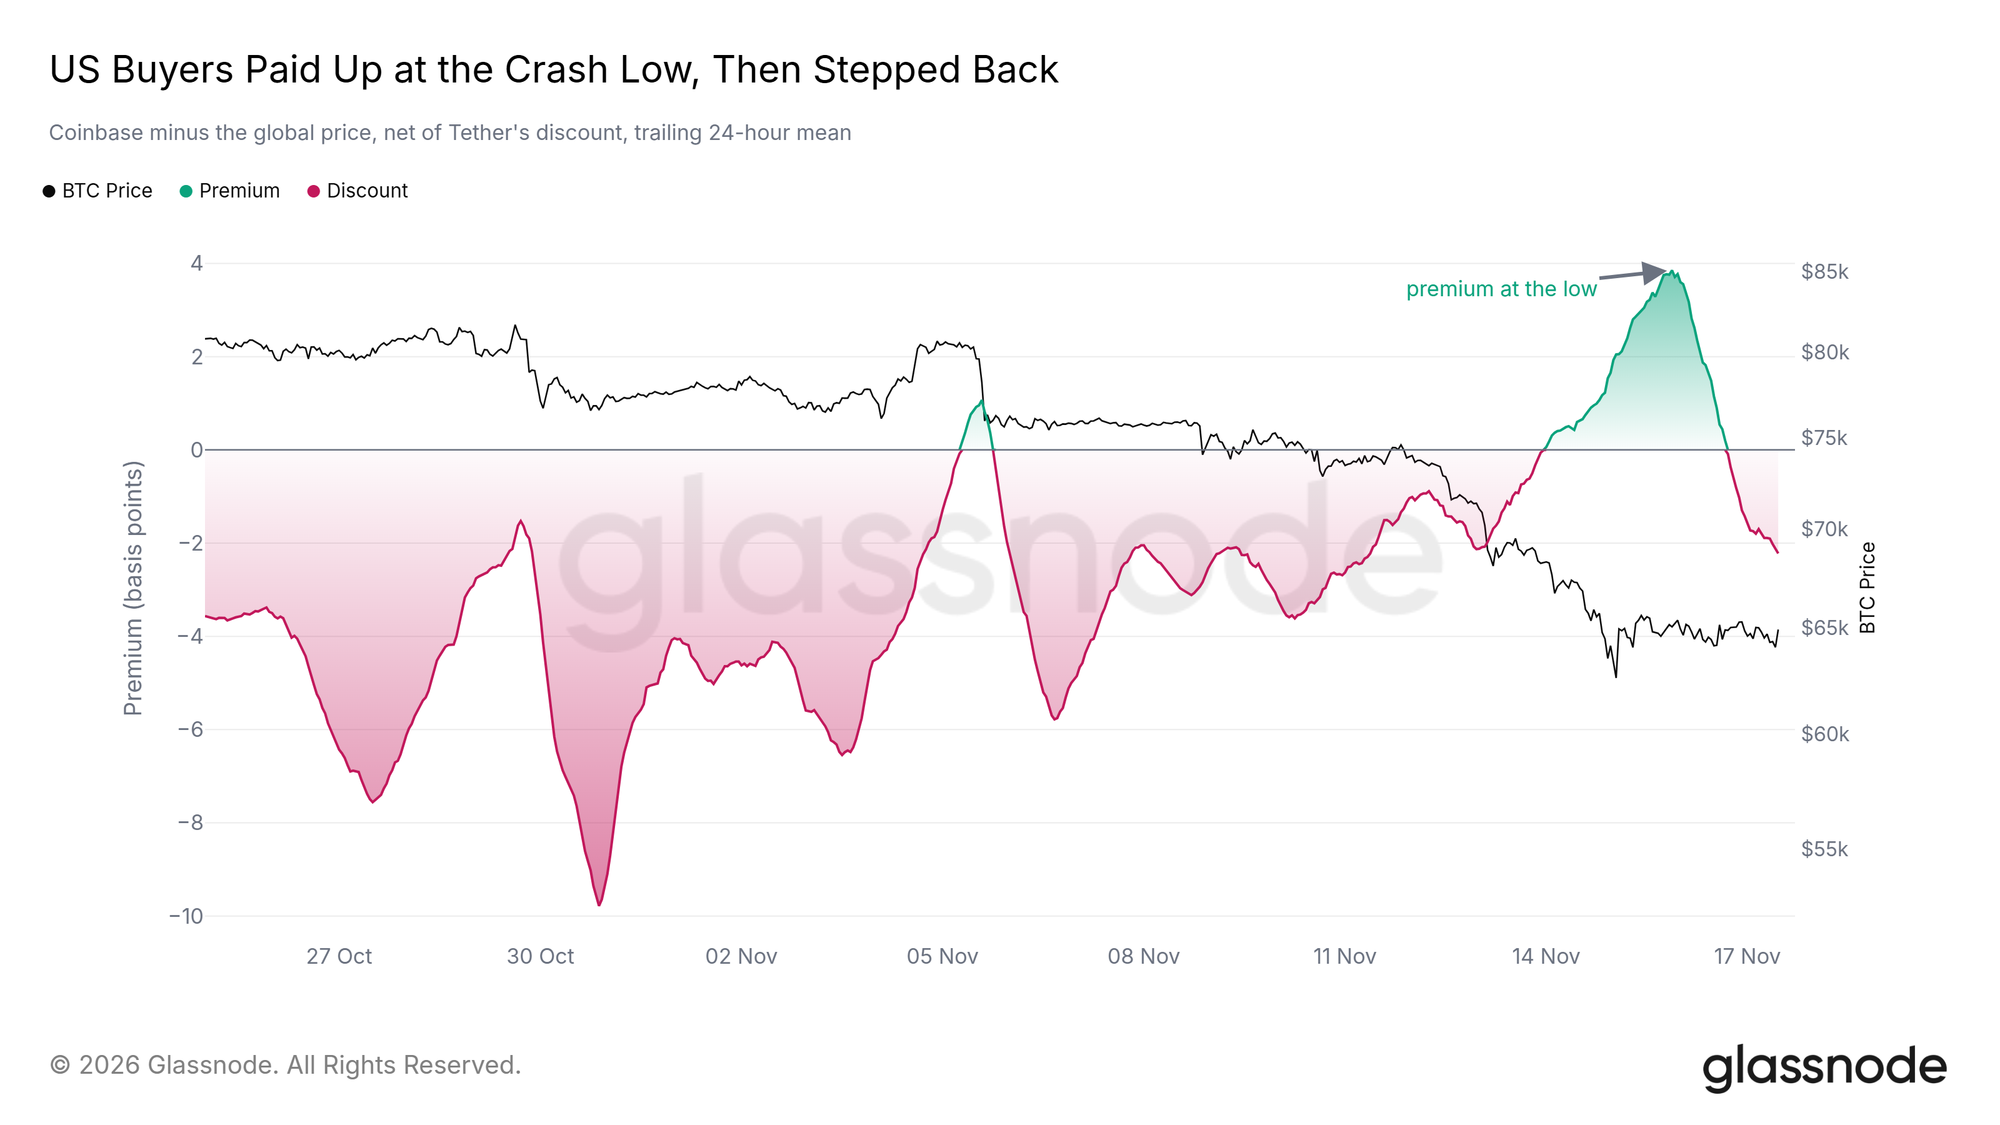
The Coinbase Premium, which compares Bitcoin’s Coinbase price with a broader market price, offered another qualified signal. After being negative almost every hour since late October, it turned positive around the market low and peaked on the evening of November 15, according to Glassnode. By the report date it had returned to a slight discount. A sustained premium would be stronger evidence of US buying than a brief spike.
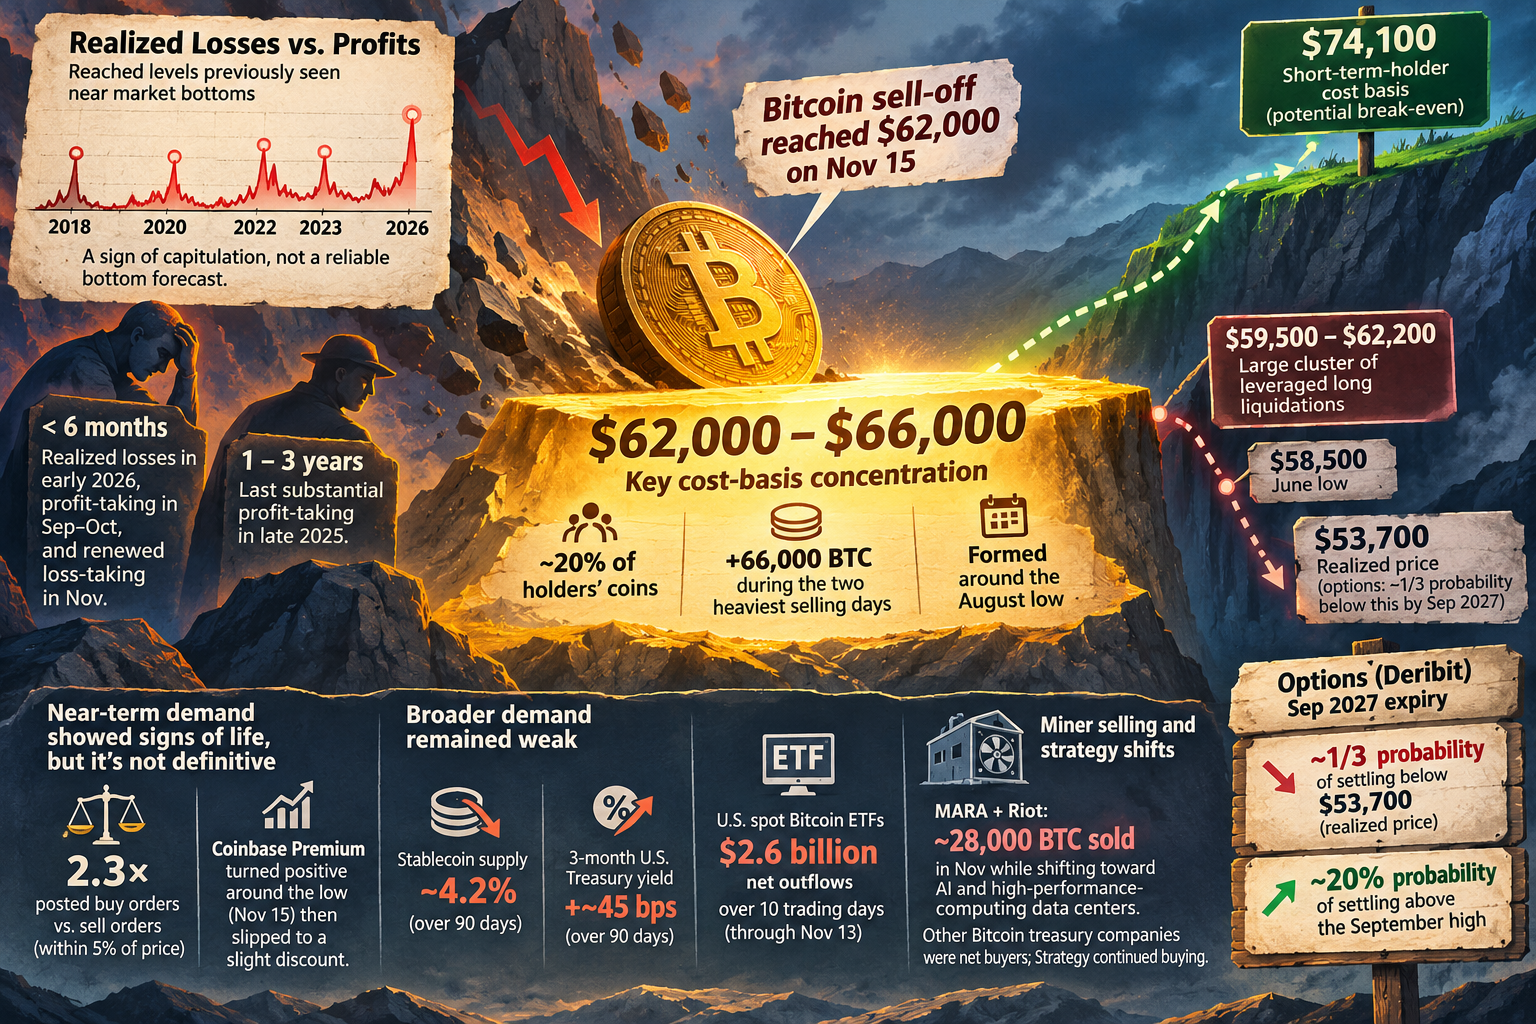

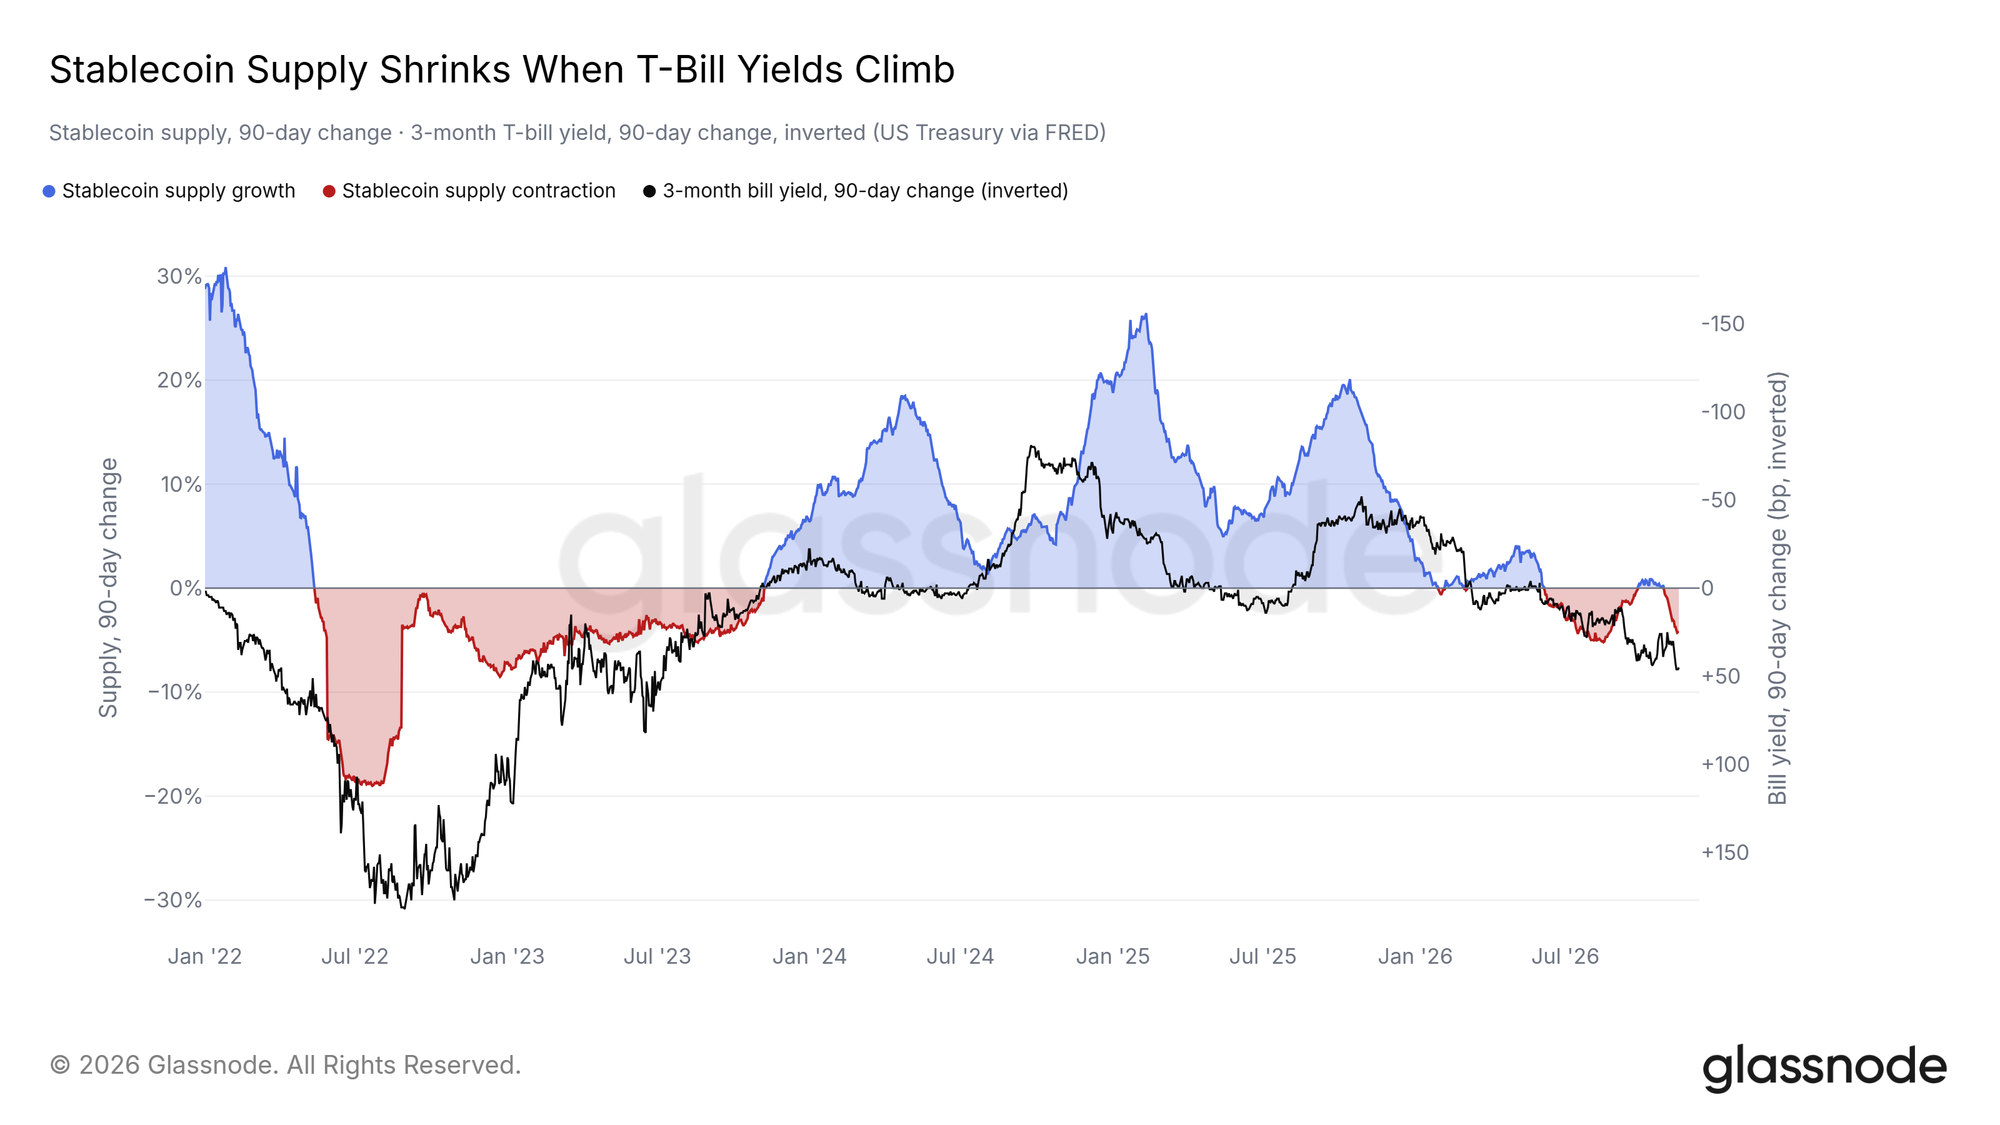
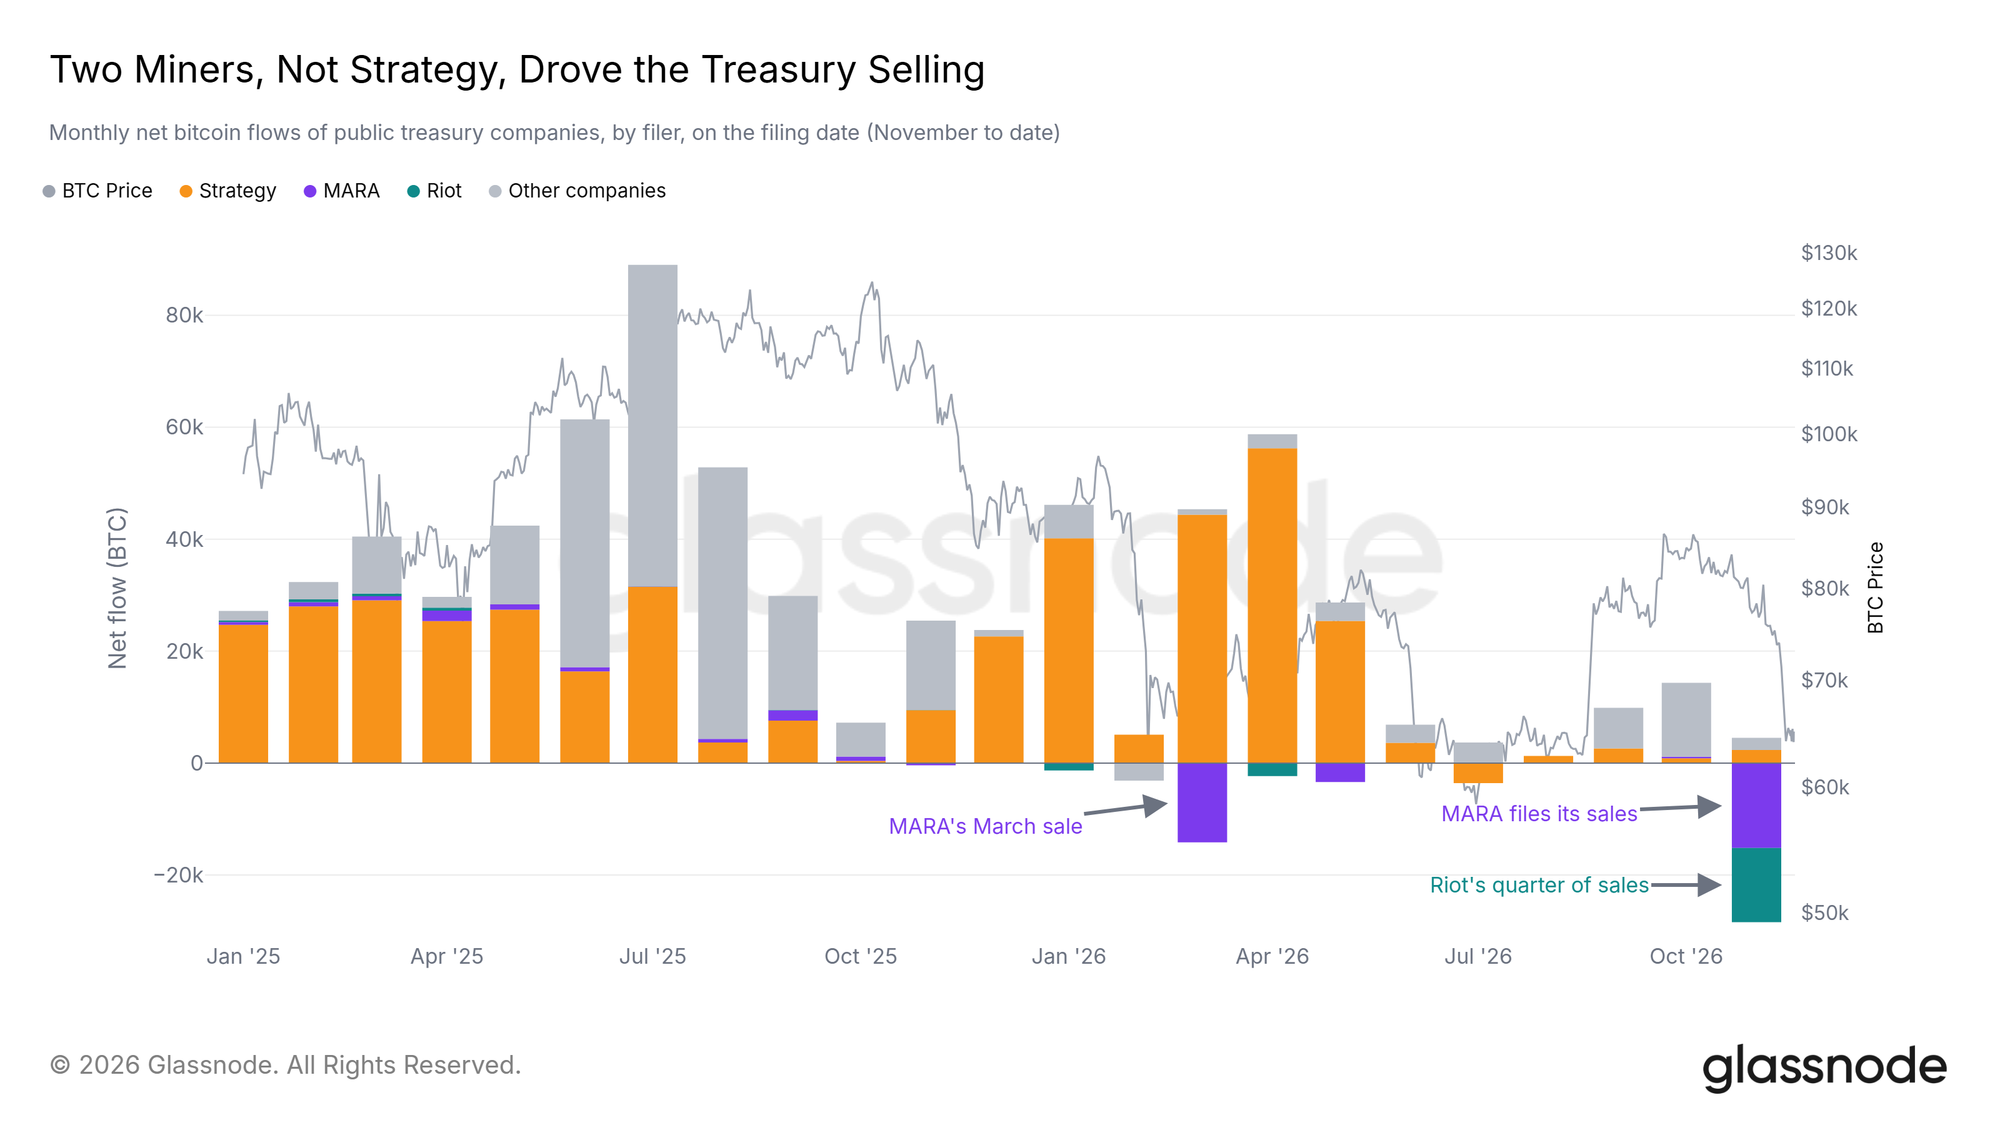
Other measures pointed the opposite way. Glassnode reported that stablecoin supply had fallen 4.2% over 90 days as the three-month US Treasury bill yield rose about 45 basis points. It argued that higher short-term yields could draw holders toward interest-bearing alternatives; the parallel moves do not, by themselves, establish how much of the decline that mechanism caused. US spot Bitcoin ETFs recorded $2.6 billion in net outflows over the ten trading days through November 13. MARA and Riot reported selling a combined roughly 28,000 BTC in November while shifting toward AI and high-performance-computing data centers; Glassnode said other Bitcoin treasury companies were net buyers that month, and Strategy continued buying.
A scenario, not a price target
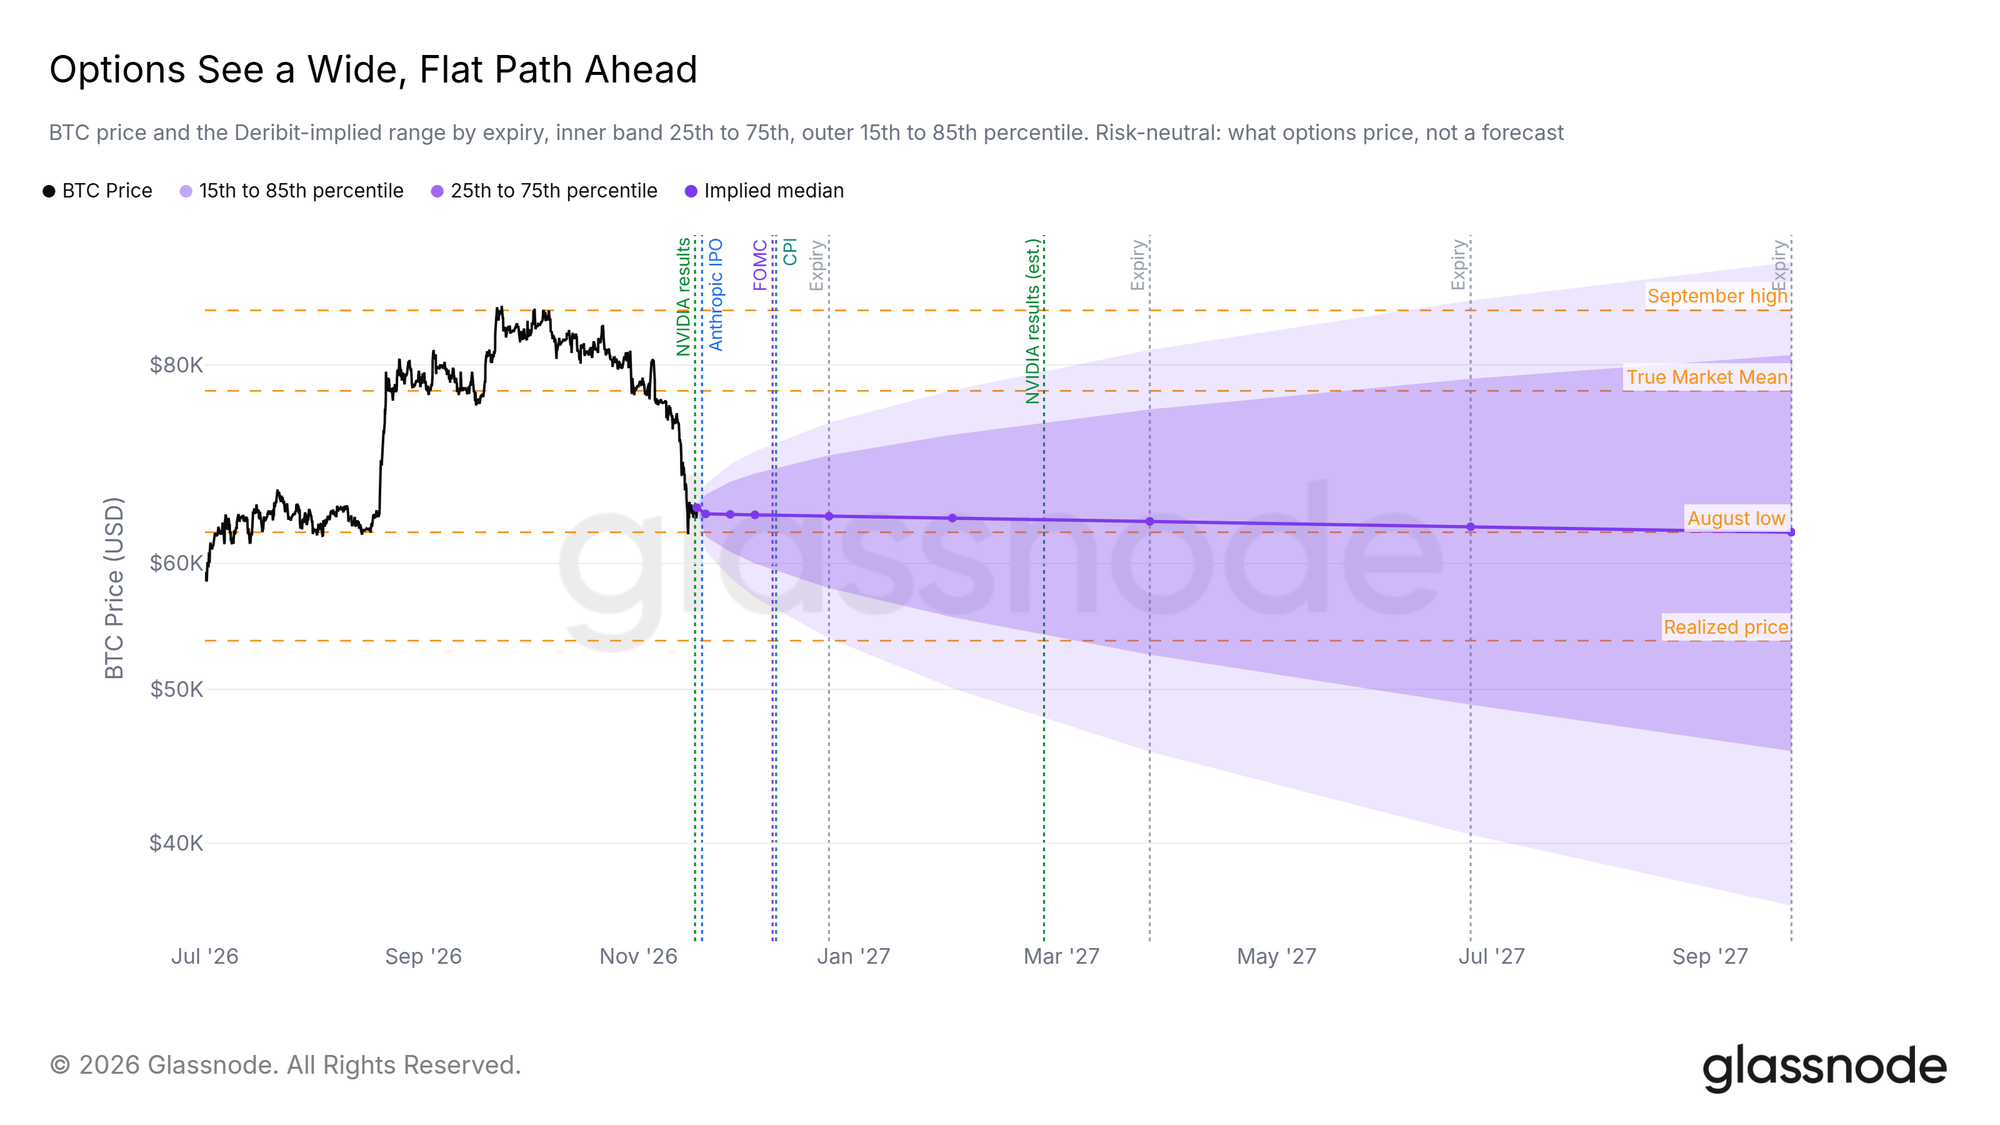
Glassnode said Deribit options implied an increasingly wide range of potential prices into 2027. For September 2027 expiry, its reading put roughly a one-third probability on settlement below Bitcoin’s $53,700 realized price and about a 20% probability on settlement above the September high. Those are market-implied probabilities at the time of analysis, not forecasts of either outcome.
The $62,000–$66,000 cost-basis concentration is therefore a useful level to watch, but it is not a floor supplied by a model. Glassnode presented a move back above $74,100 as evidence that recent buyers had regained their aggregate cost basis. Conversely, a daily close below $62,000 would weaken the August buyer cohort while exposing the lower liquidity and liquidation levels it identified. Neither historical capitulation readings nor cost-basis bands determine what price must do next.