
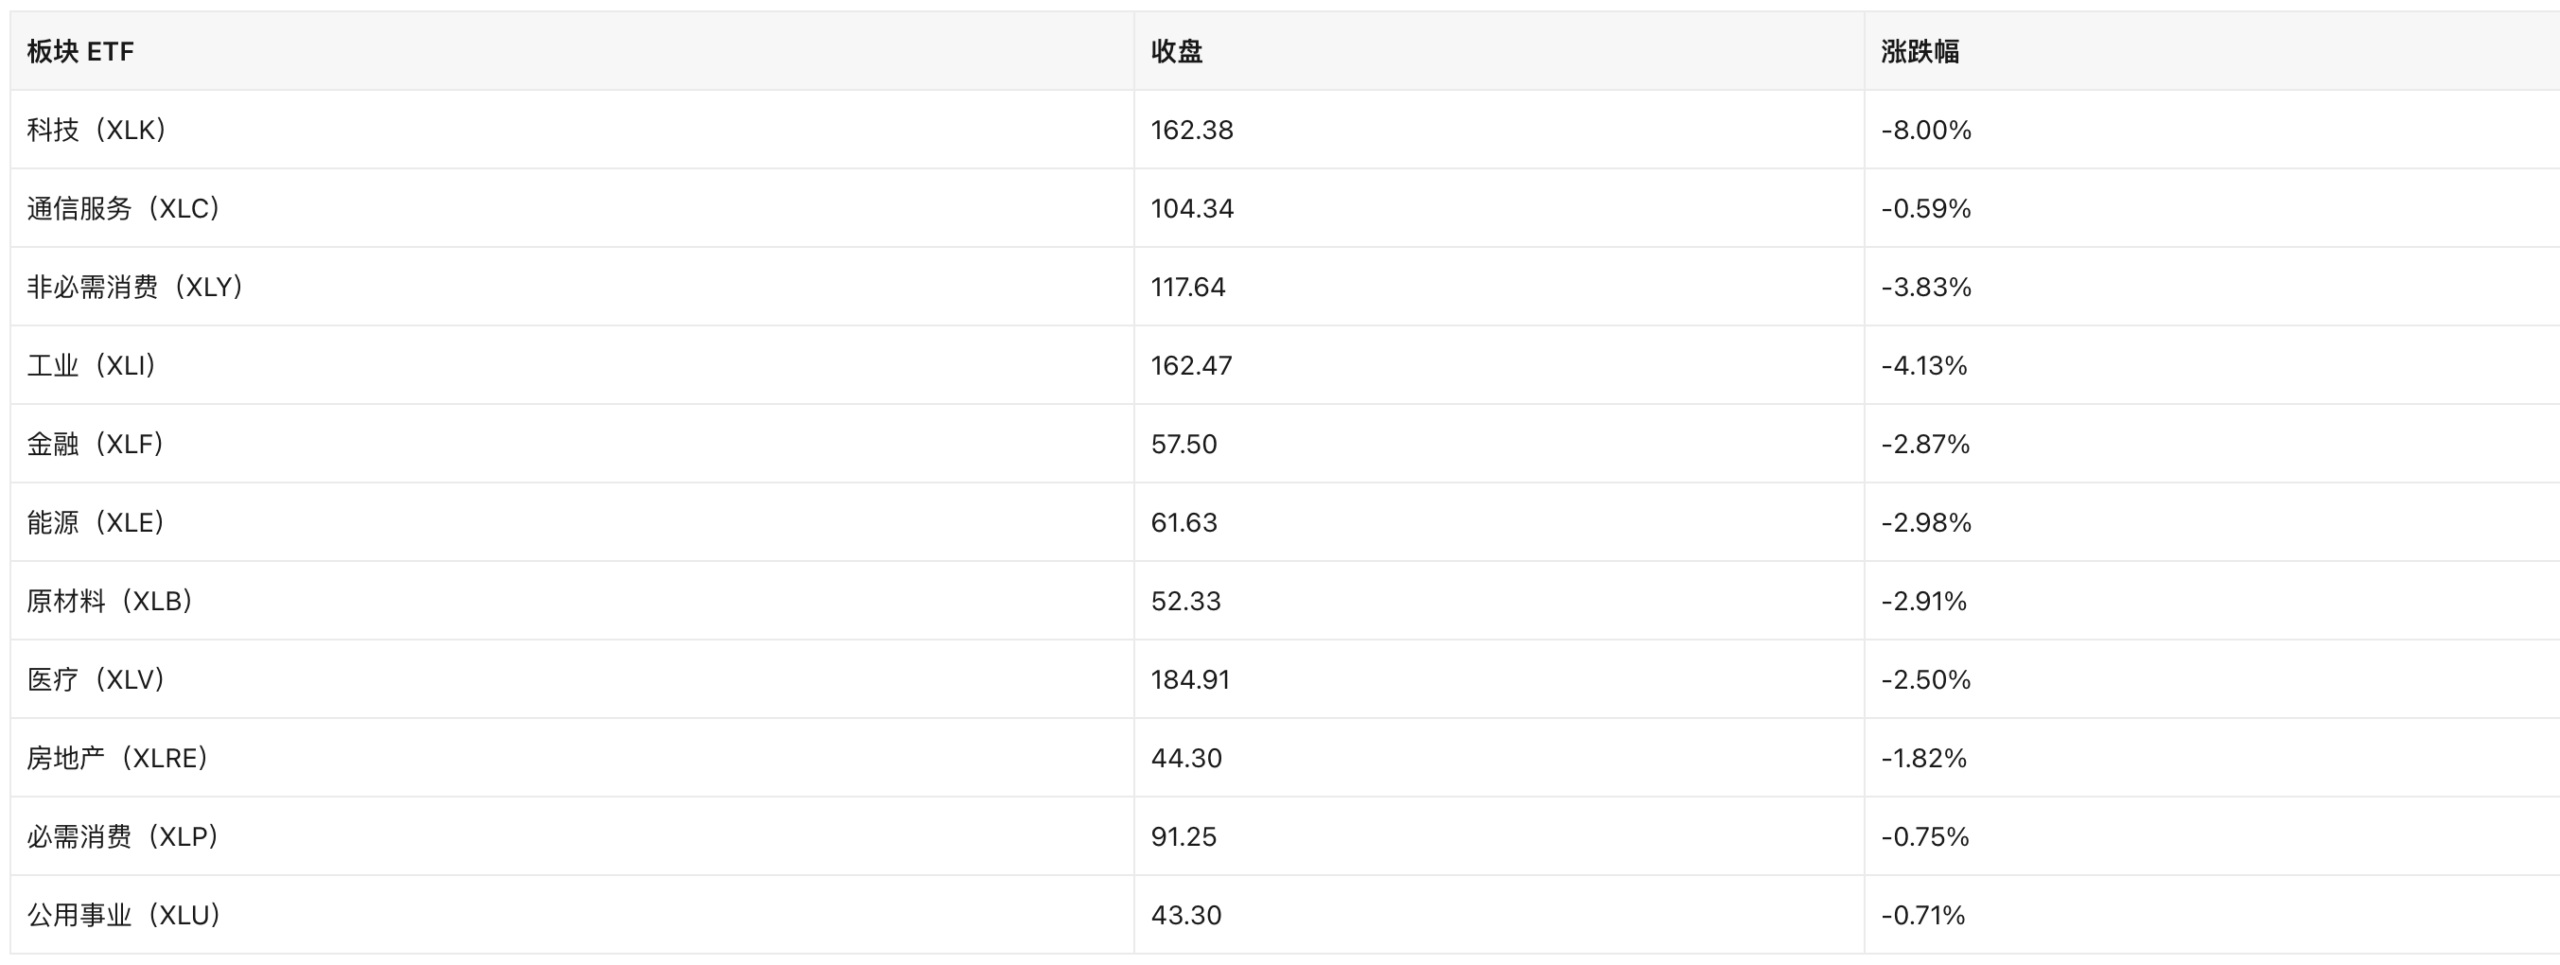
Historical context: In a report published on November 6, 2026, Bitcoin was quoted at $75,949.75, down 5.57% during the November 5 U.S. market sell-off. The Nasdaq fell 5.52% that session, while The Block reported more than $1.03 billion in crypto liquidations over 24 hours. Those figures describe the market at the time of the report, not current prices.

A price move alongside a broader sell-off
The report linked Bitcoin’s decline to a contraction in investors’ appetite for risk as technology shares fell. It identified expectations of tighter data-center policy under a Democratic-controlled Congress as one proposed driver of the equity sell-off. That was a market interpretation of potential policy, not an enacted national data-center moratorium. The report also cited rising oil prices and continuing uncertainty over the Iran war as part of the macroeconomic backdrop.
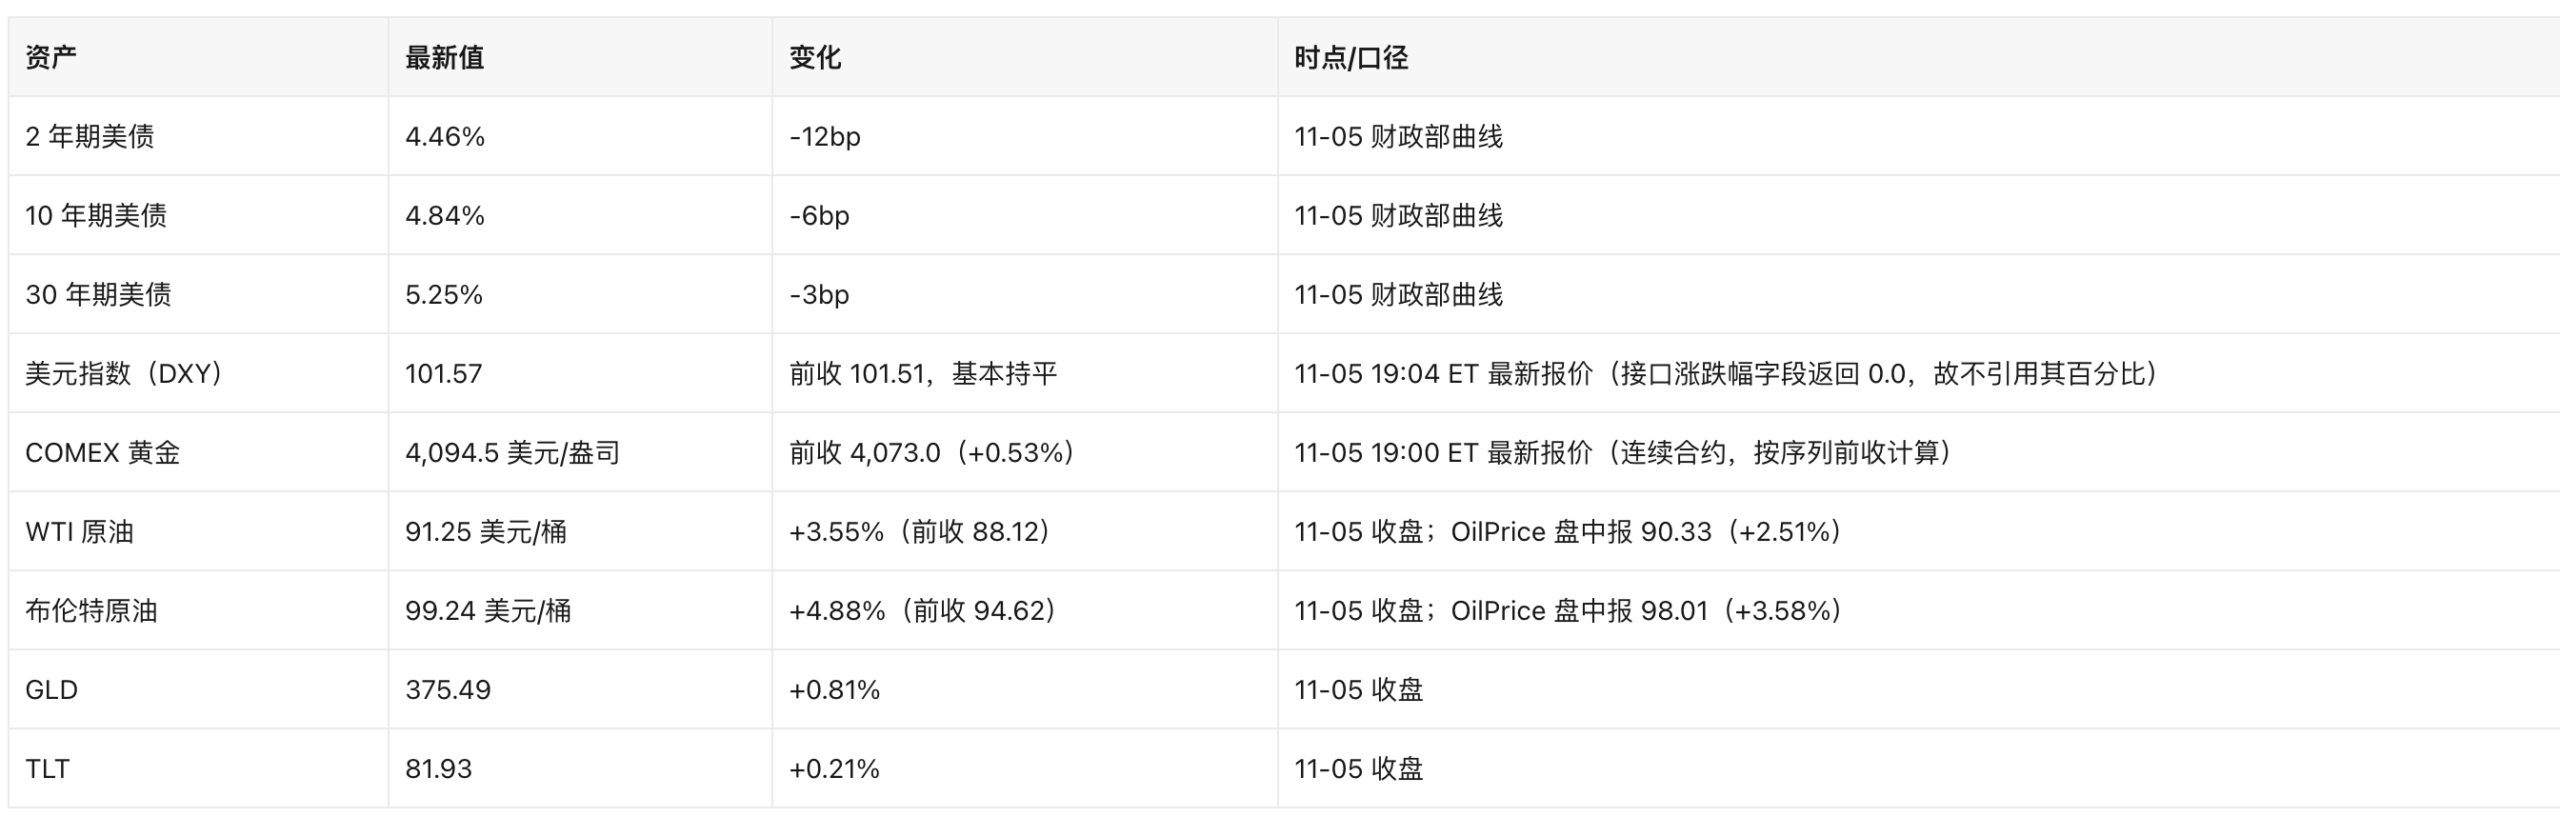
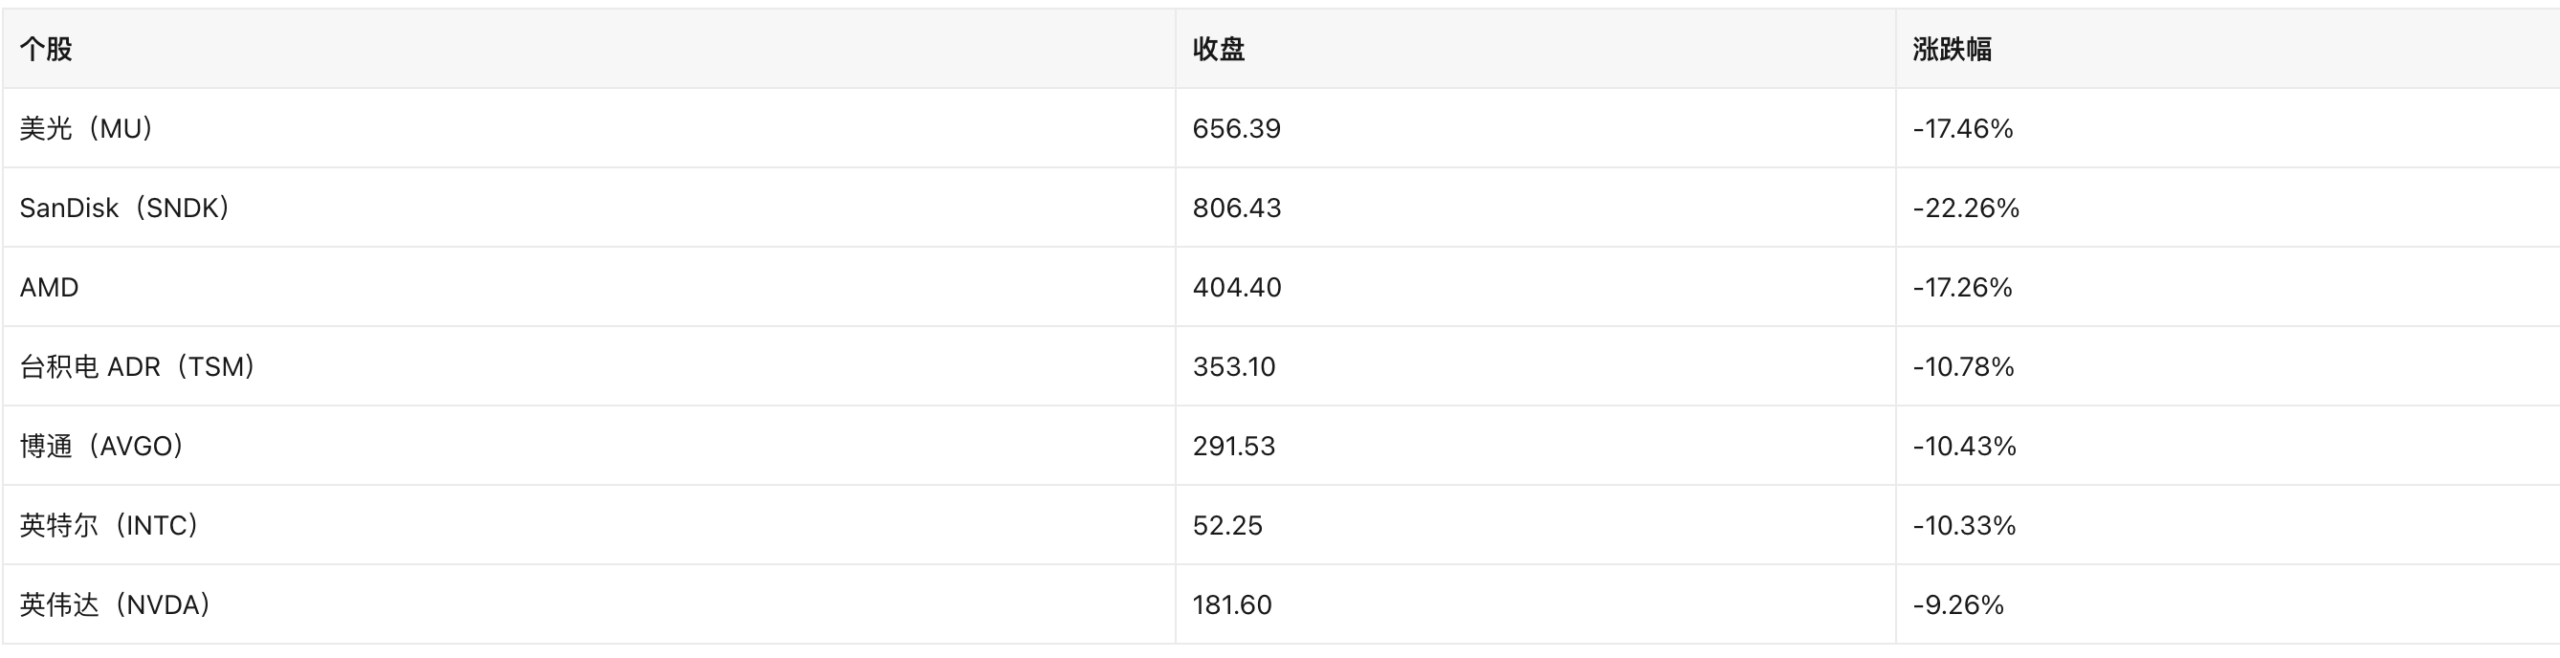

The simultaneous declines in Bitcoin and technology stocks show how the assets traded that day. One session, however, cannot establish a stable relationship or a predictive rule for Bitcoin.


Strategy’s holdings ratio—and what it leaves out
Strategy shares closed November 5 at $129.30, down 9.29%. Using the report’s closing market capitalization of about $54.99 billion, its stated holding of 849,327 BTC and Bitcoin’s quoted price of $75,949.75, the report valued the holdings at about $64.51 billion. Market capitalization divided by that estimated Bitcoin value was approximately 0.85.



That ratio is a comparison with the gross value of the Bitcoin holdings, not a complete net asset value calculation. It does not, by itself, account for liabilities, other assets or the claims of different securities. It therefore should not be read as a precise 15% discount to the company’s net assets, or as proof that any particular financing decision must follow. The report said Strategy’s average Bitcoin purchase price was $75,451, putting the quoted BTC price about 0.66% above that average; this, too, is a snapshot rather than a forecast.



ETF flows had a different reporting cutoff
U.S. spot Bitcoin ETFs recorded a combined $74.57 million net inflow on November 4, following three days of cumulative net outflows of $1.16 billion, according to the report. It put their total net assets at $102.26 billion. November 5 flow figures were not yet available when the report was prepared, so the inflow should not be treated as evidence of what happened to ETF demand during the subsequent sell-off.


Price, liquidations, a company’s holdings ratio and ETF flows measure different things—and, here, have different cutoffs. Reading them together helps describe the November 2026 episode, but none supplies a reliable Bitcoin price target.