
A Bitcoin chart in Huobi HTX chief analyst Cloud’s annual review measures price against a fixed historical range, not against a forecast. Published on November 5, 2026, the review uses daily data from HTX’s USDT-margined perpetual contracts for November 4, 2025, through November 5, 2026. Its Fibonacci levels are calculated from the Bitcoin high and low within that window: $107,736 and $57,761.
The report places the 61.8% retracement at $76,852 and the 50% level at $82,749. It says Bitcoin traded down to $76,511 during the October–November 2026 pullback, then recovered above $80,000 on November 4. At the time of the review, its quoted price was about $80,693—above the 61.8% level and below the 50% level. Those are historical reference points; neither level establishes where price must go next.
The choice of endpoints matters. Cloud separately cites a $126,199.6 Bitcoin high on October 6, 2025, outside the study window. Using that higher starting point and the same $57,761 low produces different retracement levels, including a reported 61.8% level near $83,905. A chart can therefore change its apparent nearby boundaries without any change in the latest price.
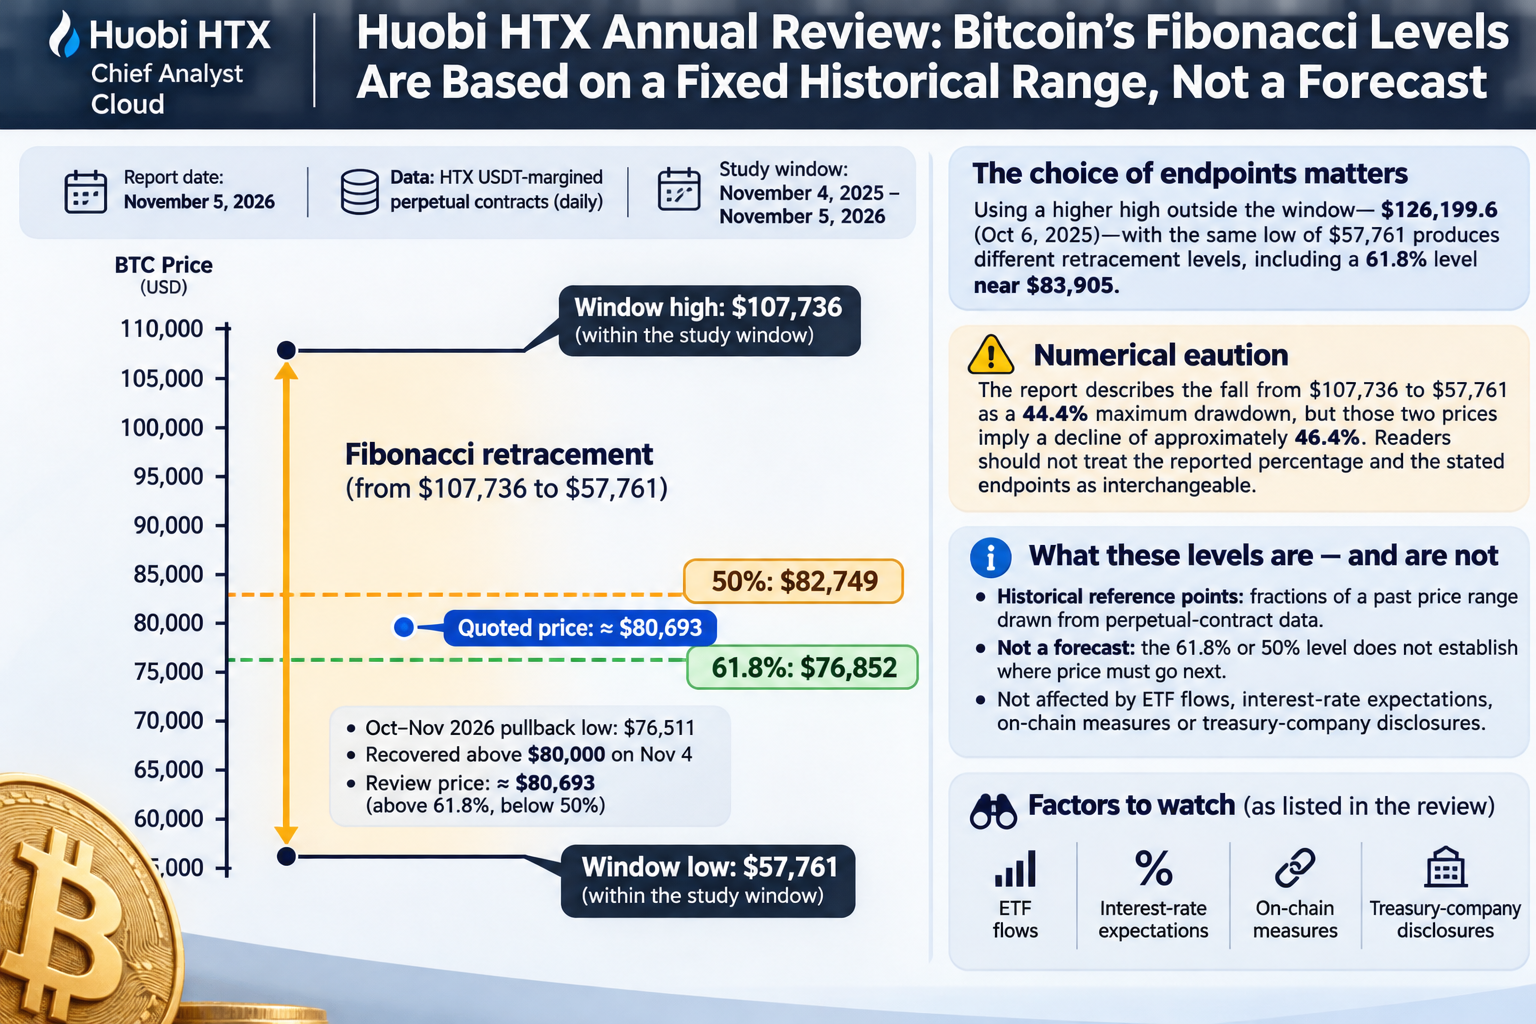
There is also a numerical caution in the review: it describes the fall from the $107,736 window high to the $57,761 low as a 44.4% maximum drawdown. Those two stated prices imply a decline of approximately 46.4%. Readers should not treat the reported percentage and the stated endpoints as interchangeable.
The review identifies ETF flows, interest-rate expectations, on-chain measures and treasury-company disclosures as factors to watch. None is an input to these Fibonacci calculations. The levels describe fractions of a past price range drawn from perpetual-contract data, not a tested prediction of Bitcoin’s future price.